CUBE Chatshaala - Discussion Summary
Date: 9th May 2026
Today’s CUBE Chatshaala session revolved around a deceptively simple question: how fast do fingernails actually grow, and what can that tell us about broader biological processes like aging? The session was anchored by real data collected by a cubist named Sailekshmi, making this a genuinely student-driven inquiry rather than a textbook exercise.
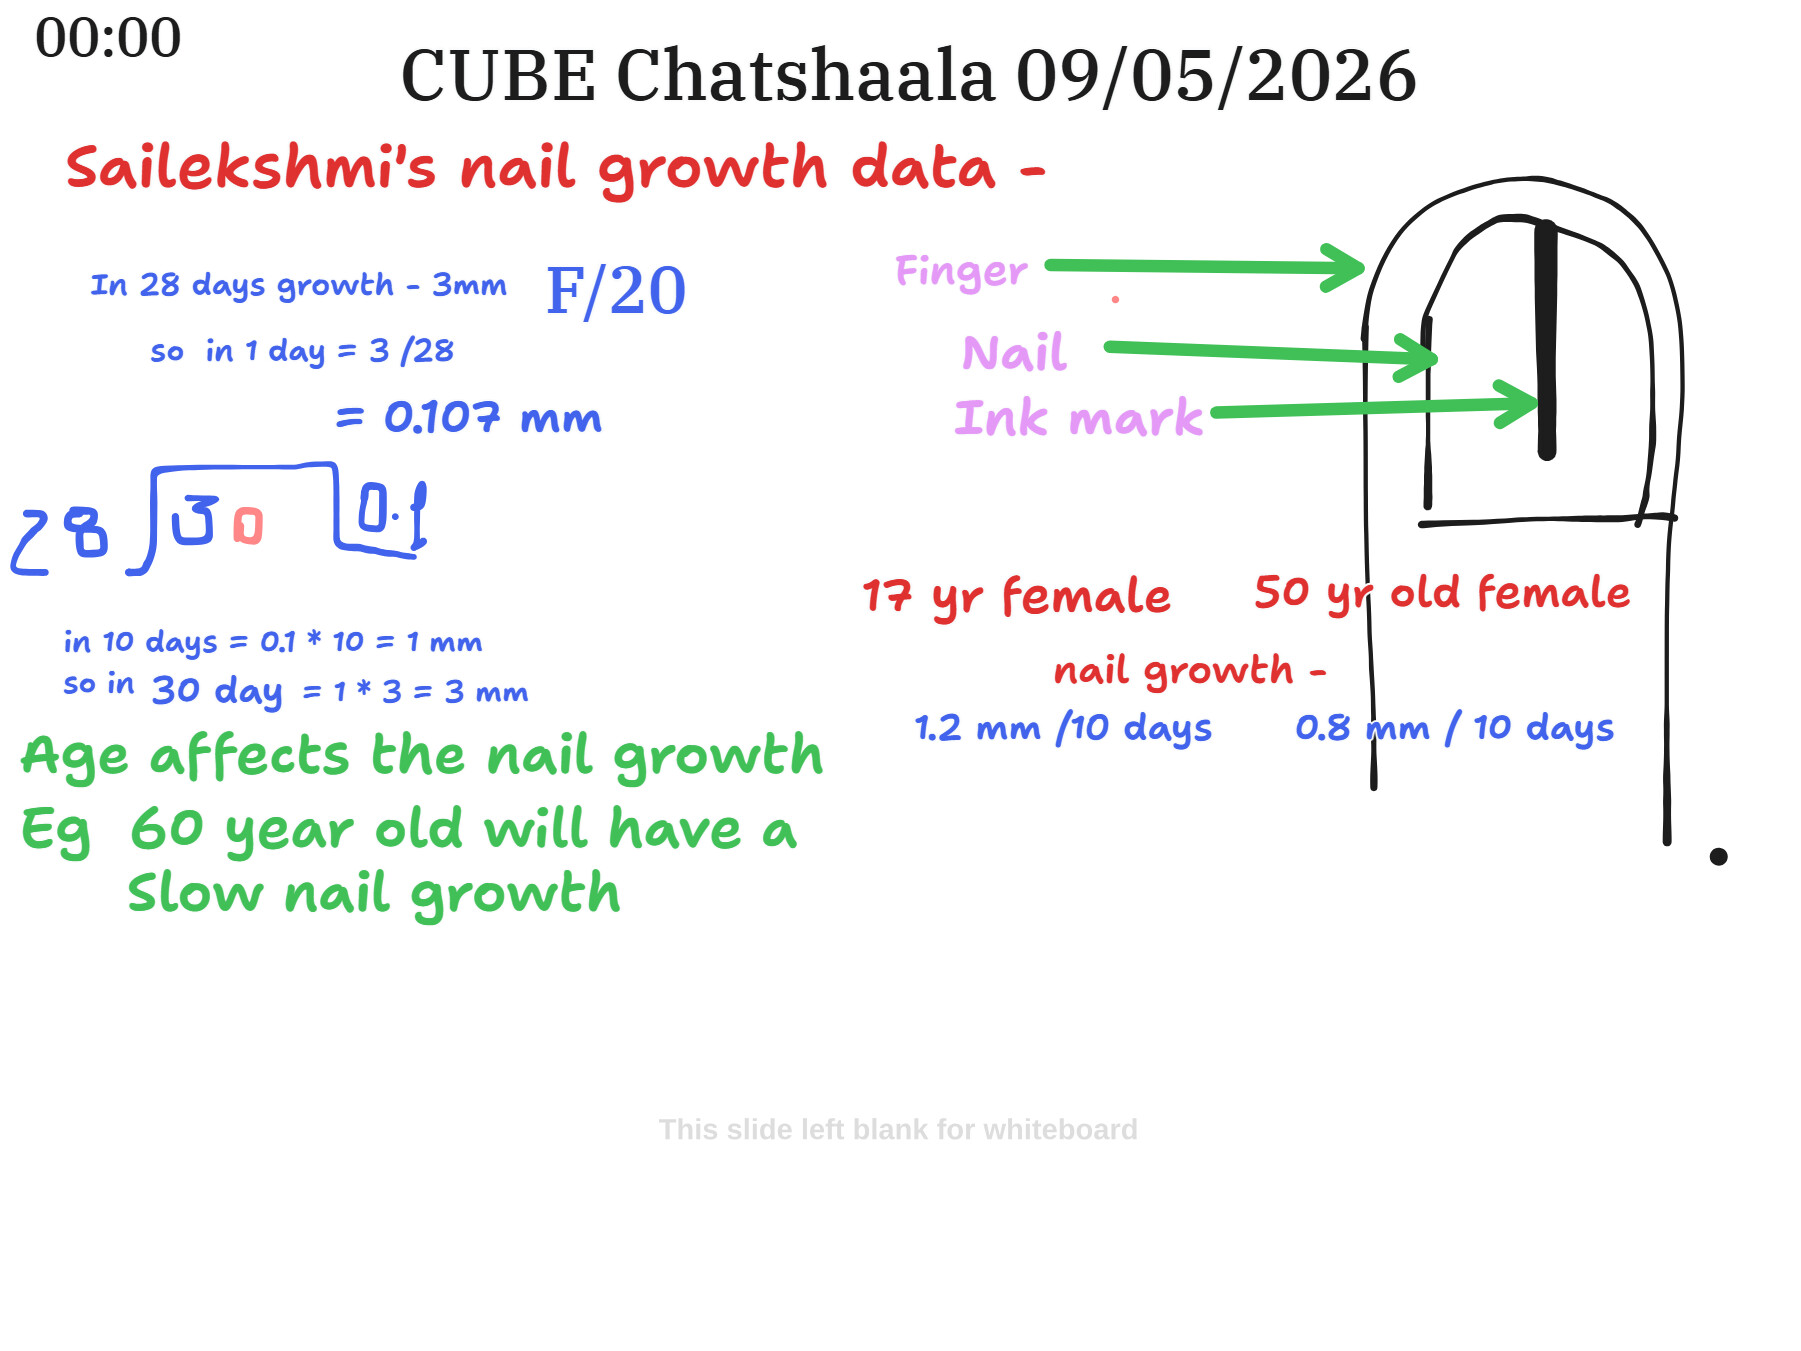
Sailekshmi presented her nail growth data, which showed that her fingernail grew 3 mm over 28 days. The group worked through the arithmetic together on the whiteboard: dividing 3 by 28 gives approximately 0.107 mm per day, which can be rounded to 0.1 mm per day. To make this easier to work with, participants noted that at 0.1 mm per day, nails would grow 1 mm in 10 days, and therefore 3 mm in 30 days. This approximation, while slightly different from the exact 28-day figure, helped the group develop an intuitive sense of the rate. The finger studied was labeled F/20, suggesting a specific finger was selected and documented in a consistent, systematic way.
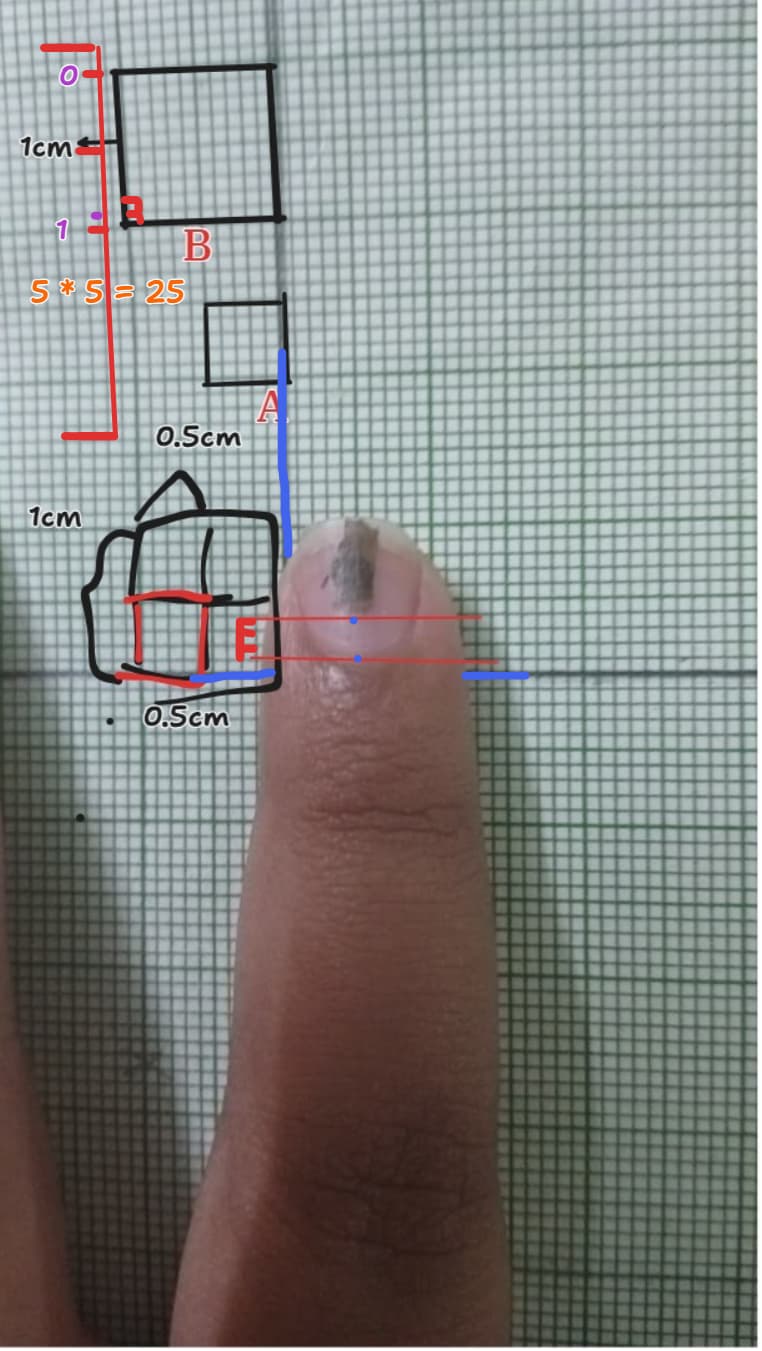
A key part of the methodology discussion involved how Sailekshmi actually tracked growth. The whiteboard showed a diagram of a finger with three reference points: the finger itself, the nail, and an ink mark. The ink mark serves as a fixed reference point placed at the base of the nail, so as the nail grows outward, the distance between the ink mark and the nail tip can be measured over time. This is a clean, low-cost method to track nail growth without any specialized equipment — something that can be done with graph paper and a pen, as demonstrated in the second image, where a thumb is placed against graph paper with measurements of 1 cm and 0.5 cm sections clearly annotated. Labels A, B, and F mark different positional references on the nail and finger, and the calculation 5 × 5 = 25 appears to refer to counting grid squares to estimate area or distance.
From Sailekshmi’s baseline, the discussion expanded into the relationship between age and nail growth. The whiteboard compared two females: a 17-year-old whose nail grew 1.2 mm in 10 days, and a 50-year-old whose nail grew only 0.8 mm in 10 days. This difference immediately raised the question of whether age is a key variable in nail growth rate. The group concluded that age does appear to affect nail growth, with the general observation that a 60-year-old would likely have even slower nail growth than a 50-year-old. This connects to a broader biological principle: as we age, metabolic rate slows, cell turnover decreases, and peripheral blood circulation diminishes, all of which influence how quickly the nail matrix produces new nail plate.
This connects to the peer-reviewed literature as well. A 2024 paper published in Skin Appendage Disorders (Prudkin et al., PMC11147530) examines how the “exposome” — the totality of environmental exposures across a lifetime — affects nail health. The nail unit is described as a complex biological system sensitive not just to age, but also to nutrition, disease, hormonal changes, and external environmental factors. This framing enriches the CUBE discussion considerably: Sailekshmi’s data is not just a number; it is a data point within a much larger and more complex biological story.
The session closed with participants recognizing that nail growth rate is a window into systemic health, not merely a cosmetic observation. Tracking it over time, across individuals of different ages, and under different conditions, could constitute a meaningful citizen science project.
 Provocative Questions
-
Sailekshmi’s nail grew 3 mm in 28 days, but the group approximated this as 0.1 mm per day (i.e., 3 mm in 30 days). Is this approximation acceptable in scientific practice? At what point does rounding introduce an error significant enough to change conclusions?
-
The 17-year-old grew nails at 1.2 mm/10 days while the 50-year-old grew at 0.8 mm/10 days. Is this difference solely due to age, or could other variables — diet, dominant hand, health conditions, season — be responsible? How would you design a study to isolate age as the variable?
-
If a 60-year-old is predicted to have “slow nail growth,” what would the actual rate be? Can we extrapolate from the two data points (17-year-old and 50-year-old) to estimate nail growth rate as a function of age? What kind of mathematical relationship (linear, exponential, logarithmic) might best describe this?
-
The ink mark method is used to track nail growth. What are the potential sources of error in this method? How might the mark shift, fade, or be disrupted? Can you think of a more reliable alternative that still uses no expensive equipment?
-
The second image shows a thumb placed against graph paper with measurements of 0.5 cm and 1 cm. What exactly is being measured here? Is it the nail length, the distance from the ink mark, or the width of the nail? Why does it matter to be precise about what is being measured?
-
Nails grow from the nail matrix, which lies beneath the skin at the base of the nail. If cell division in the matrix slows with age, what biological mechanism might explain this? Is it the same mechanism that slows wound healing and hair growth in older individuals?
-
The literature mentions that the “exposome” — environmental exposures across a lifetime — influences nail health. Could Sailekshmi’s nail growth data be affected by environmental factors in her daily life (nutrition, hydration, sunlight, stress)? How would you control for these in a long-term study?
-
Nail growth is known to be faster in summer than in winter in some studies. If Sailekshmi collected her data in a particular season, could that affect her results? Should seasonal variation be recorded as a standard part of the methodology?
-
Can nail growth rate be used as a proxy for overall biological age, distinct from chronological age? What other simple, observable biological markers could be tracked alongside nail growth to build a more complete picture of an individual’s aging rate?
-
The whiteboard labels the finger as “F/20.” What does this notation system mean? Is it referring to the finger number, the participant code, or something else? Why is it important to have a consistent labeling system in citizen science data collection?
 What I Have Learned
Sitting through this session reminded me that good science does not always require expensive equipment or a formal laboratory. Sailekshmi’s study is a perfect example of what CUBE stands for: biology investigated with care, curiosity, and consistency, using the most basic tools available. A pen, a ruler, a piece of graph paper, and a willing fingernail turned out to be enough to open a meaningful conversation about cell biology, aging, and scientific methodology.
The arithmetic worked through on the whiteboard — moving from 3 mm in 28 days, to 0.107 mm per day, to a working approximation of 0.1 mm per day — showed how simplifying a measurement without losing its essential meaning is itself a skill. Science often requires knowing when precision is necessary and when a clean approximation is good enough to think with.
The comparison between the 17-year-old and 50-year-old nail growth rates made visible something I had always assumed but never actually quantified: that aging slows biological processes we rarely pay attention to. A difference of 0.4 mm per 10 days might seem trivial, but scaled across tissues and organs throughout the body, it represents a meaningful shift in cellular metabolism and repair.
I also learned to think more carefully about measurement methodology. The ink mark as a reference point is clever, but it is not foolproof. Thinking through potential sources of error — not just accepting the method at face value — is what separates careful science from casual observation.
Finally, connecting the classroom data to the peer-reviewed article on the exposome was a valuable reminder that student-collected data exists within a much larger body of knowledge. The variables that affect nail health — age, nutrition, environment, disease — are the same variables that affect the health of the organism as a whole. A small experiment about nails turns out to be a conversation about life itself.
 TINKE Moments (This I Never Knew Earlier)
TINKE 1: The Rate is Slower Than Intuition Suggests
Most participants probably assumed nails grow faster than 0.1 mm per day. Realizing that it takes nearly a month for a nail to grow just 3 mm is genuinely surprising. This challenges assumptions about how quickly the body renews itself and opens the door to questions about what drives or limits that rate.
TINKE 2: Age Has a Measurable Effect Even Between 17 and 50
The difference between 1.2 mm/10 days (age 17) and 0.8 mm/10 days (age 50) was a concrete, data-backed illustration that aging is not just about wrinkles and grey hair — it is visible even in something as mundane as how fast a nail grows. This was a small but powerful moment of connecting abstract biology to lived experience.
TINKE 3: The Ink Mark as a Scientific Instrument
The realization that something as simple as an ink mark on a fingernail can serve as a reliable reference point for scientific measurement was an eye-opener. It democratizes biology — you do not need a lab to do real science. This is the spirit of CUBE, and seeing it made explicit through the diagram on the whiteboard was genuinely clarifying.
TINKE 4: Graph Paper as a Measurement Tool
The second image, showing a thumb held against graph paper with annotated measurements, showed that the grid squares themselves can substitute for a ruler. The calculation 5 × 5 = 25 (counting grid squares to get area or linear measurement) demonstrated that quantitative biology can be done with materials found in any classroom or home.
TINKE 5: Nail Growth as a Window into Systemic Aging
Perhaps the most significant TINKE of the session was the realization that nail growth rate is not a trivial statistic — it is a proxy for deeper biological processes, including cell division rate in the nail matrix, peripheral circulation, and hormonal activity. The connection to the exposome literature showed that nails carry a biological record of how a person has lived.
Gaps and Misconceptions
Gap 1: No Data on Other Fingers
Sailekshmi collected data for one finger (F/20). It is well established that different fingers grow at different rates — the middle finger tends to grow fastest, while the thumb and little finger grow more slowly. Without data from multiple fingers, it is difficult to know whether the 3 mm / 28 days figure is representative of her overall nail growth or specific to that one finger. Future data collection should include at least two or three fingers for comparison.
Gap 2: The Age Comparison Lacks Controls
The comparison between the 17-year-old (1.2 mm/10 days) and the 50-year-old (0.8 mm/10 days) is interesting but presented without any information about whether these are the same finger, measured over the same period, under the same conditions. Without controlling for these variables, the age comparison remains suggestive rather than conclusive. It is a good hypothesis-generating observation, but not yet a controlled experiment.
Gap 3: The “60-year-old will have slow nail growth” Statement Needs Data
The whiteboard notes that “age affects nail growth” and gives a 60-year-old as an example of slow growth, but no actual measurement is provided for this age group. This is a prediction or an extrapolation, not a data point. Participants should be encouraged to distinguish between what has been measured and what is being inferred.
Misconception 1: Rounding 28 Days to 30 Days is Always Acceptable
The group moved smoothly from “3 mm in 28 days” to “3 mm in 30 days” as an approximation. While this is a reasonable simplification for mental arithmetic, it could become a misconception if students begin to treat approximations as exact values. It is worth explicitly acknowledging: 3/28 = 0.107 mm/day, and 3/30 = 0.1 mm/day. The difference is small (about 7%), but in longer calculations or larger datasets, such rounding can accumulate into meaningful error.
Misconception 2: Slower Nail Growth = Worse Health in All Cases
There may be an implicit assumption that slower nail growth is always a sign of declining health. In reality, nail growth rate varies enormously by individual, season, nutrition, and dominant hand. A slower rate is not necessarily pathological — it may simply reflect a different baseline. Participants should be careful not to over-interpret the age comparison as indicating that older individuals are “less healthy” simply because their nails grow more slowly.
Misconception 3: The Ink Mark Method is Perfectly Accurate
The ink mark is a clever low-cost tool, but it is not infallible. The mark can smudge, wash off, or shift. The measurement of growth depends on how consistently the mark was applied and read at each time point. Students may assume that because the method is simple, it is error-free — but simplicity and accuracy are not the same thing. Discussing sources of error openly would strengthen the scientific rigor of the project.