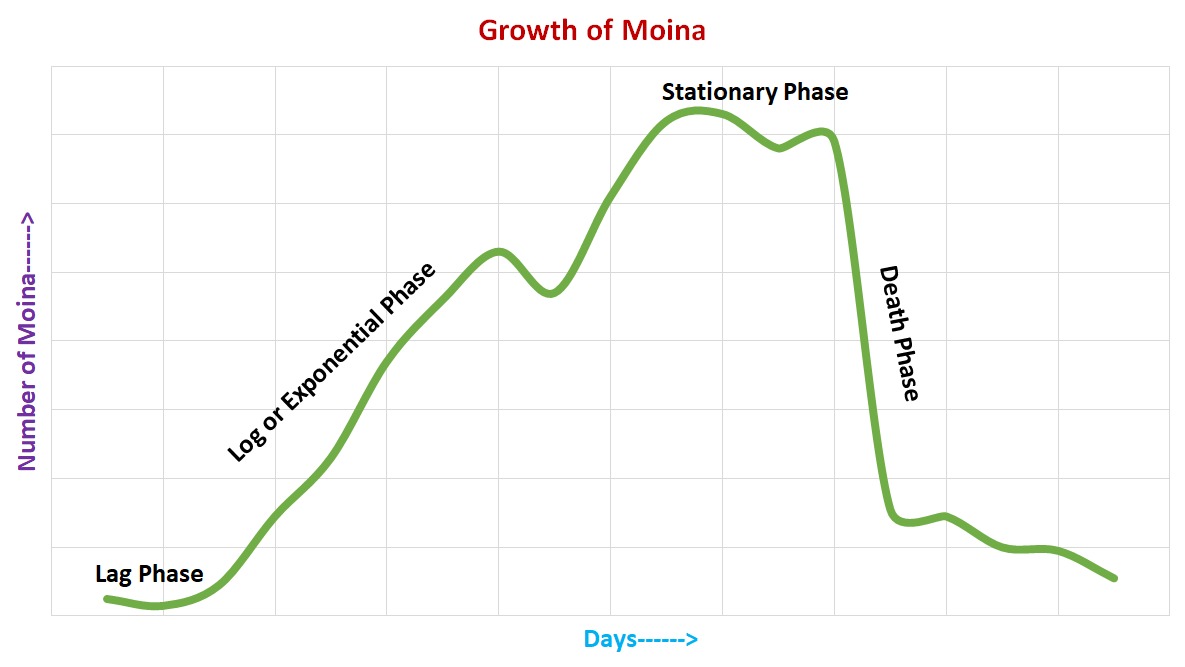
A growth curve of Moina that includes the data from 6th September 2020 to 30th September 2020 i.e. 25days.
This graph is plotted by taking average readings of the number of Moina in five bottles.
New cultures (five bottles) were made on 6th Sept 2020 by adding 250mL of dechlorinated water+5 Moina+1 drop of milk.
This Moina growth curve has a rough resemblance (with some variations) with the bacterial growth curve.
The phases are Lag, Log/Exponential, Stationary and Death phase.
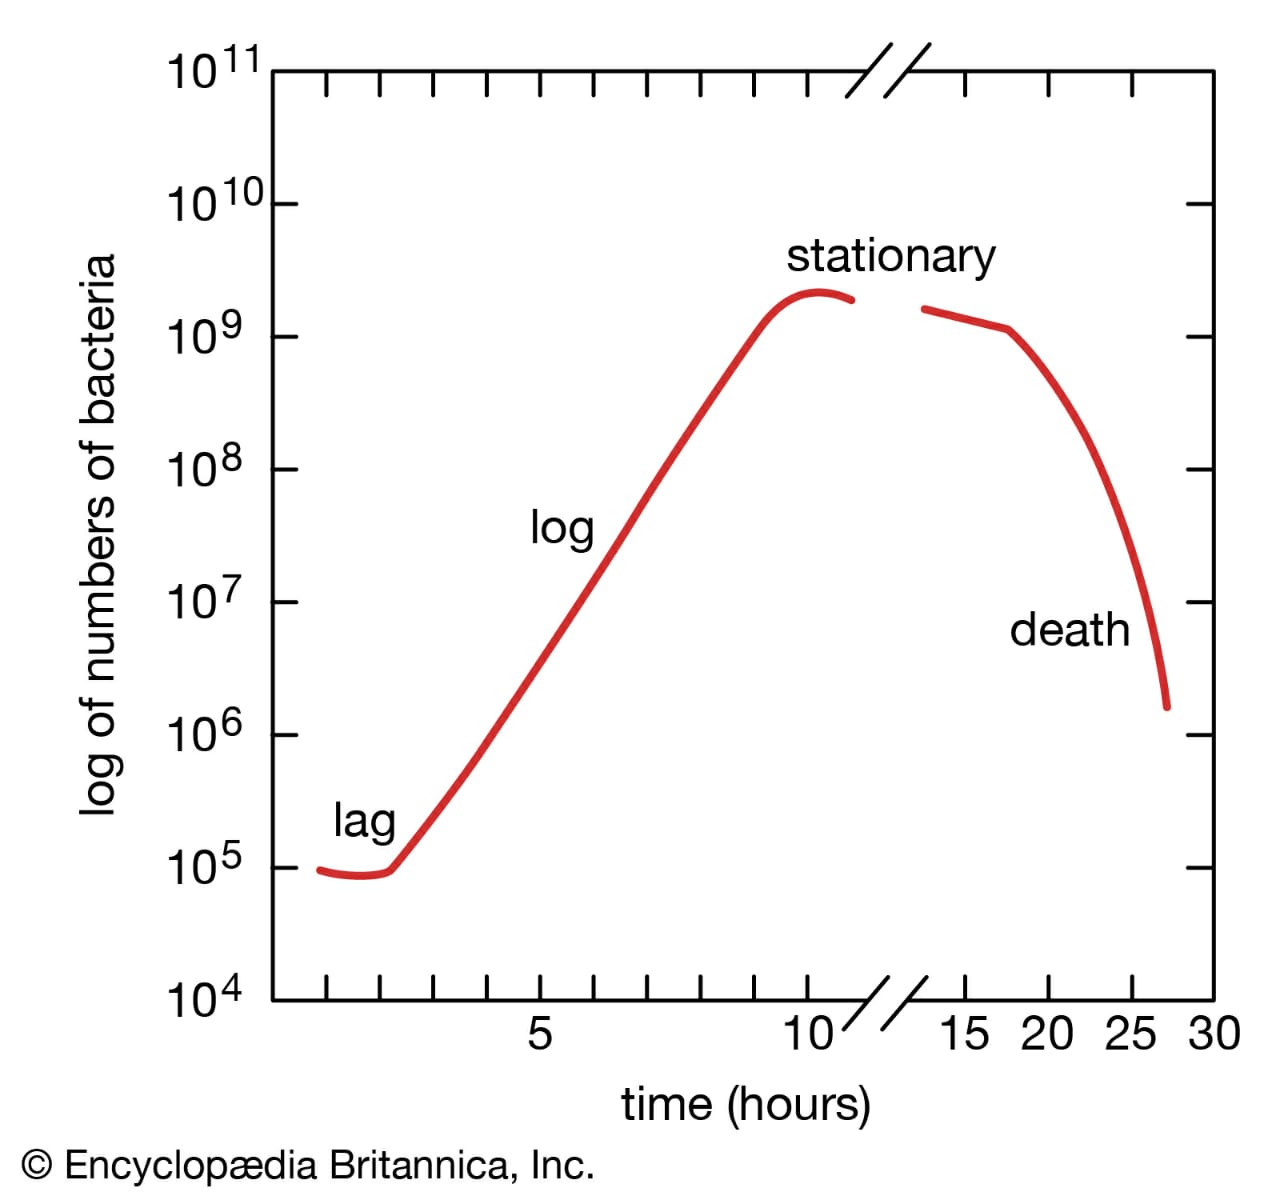
A bacterial growth curve taken as a reference for comparison with Moina growth curve.
This graph was sent by @Jaikishan during one of the ChatShaala’s last week.
In the Lag Phase, the organism is getting used to the conditions provided to it.
Log Phase indicates the multiplication of the organism rapidly, thus an increase in the number is seen.
In the Stationary Phase, the number of organisms remain constant even though some continue to multiply, others begin to die.
The Death Phase shows a sharp decline in the number of organisms.
All of these phases are common between both of the growth curves shown above.