29th January 2021
CUBE CHATSHAALA
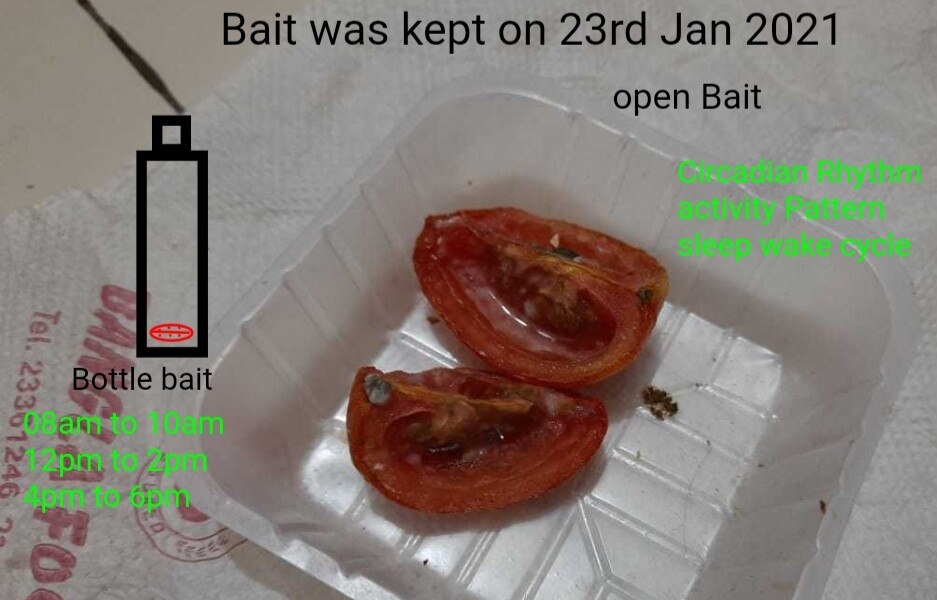
Raj has been trying to get Fruit flies at his Place New Delhi and it’s been a week and not a single fruit fly has visited the bait…
Since it’s an open bait there has a chance that some flies must have visited and laid some eggs…
Aswathy suggested to keep eye on bait from 08am to 10am in the morning, 12pm to 2 pm and 4pm to 6pm as per her experience…
Aswathy had observed Activity pattern of fruit flies and from that data we could conclude fruit flies are active at time which mentioned above.
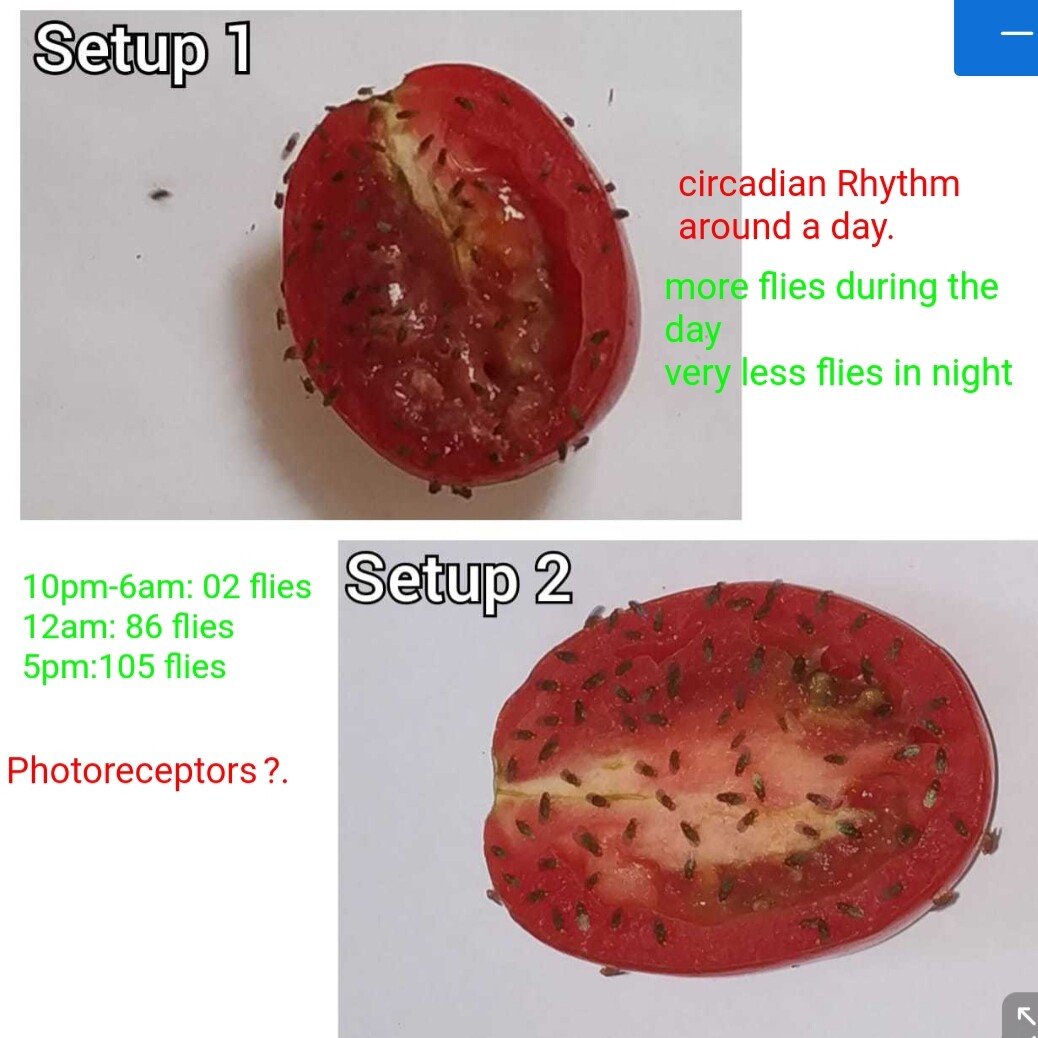
Above picture was shared by Aswathy and this picture was clicked when circadian rhythm was studied by Aswathy.
The question was how does fruit fly knows that it’s the time to Being Active and not active?.
How do they sense day and night?.
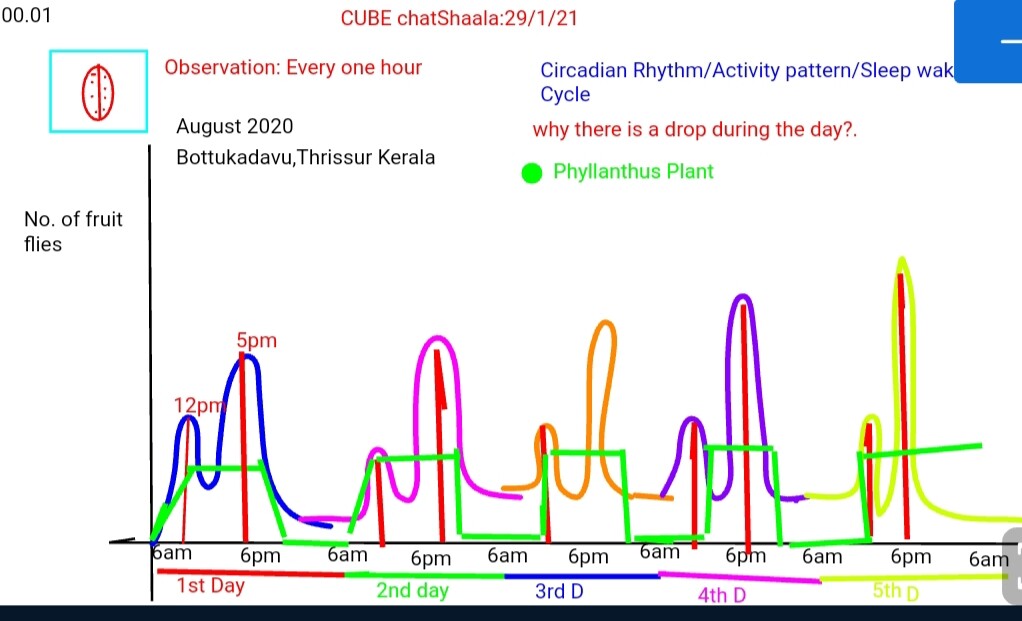
Circadian rhythm study was conducted by Aswathy during the Month of August 2020 and Aswathy did that for 5 subsequent days.
We had discussed the procedure in detail and we had attempted to plot a graph for all the 5days data and saw the pattern is actually repetitive, fruit flies follows a certain rhythm…
The question was why there’s a drop during day time in between 12pm to 5pm?.
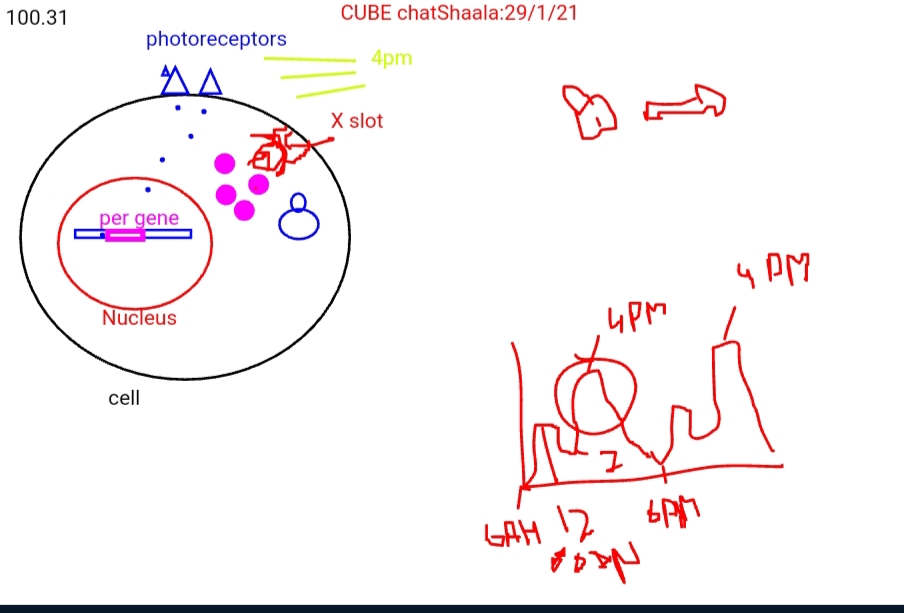
Cubists had tried to propose a model which would enabled them to understand what’s happening at cellular and molecular level in the fruit fly in regulating repetitive rhythm in sleep wake cycle…
Phyllanthus plant was also discussed a bit since it also follows a rhythm of opening and closing it’s leaves in the morning and in the evening respectively…
Is this Rhythm totally regulated by internal mechanism.?..
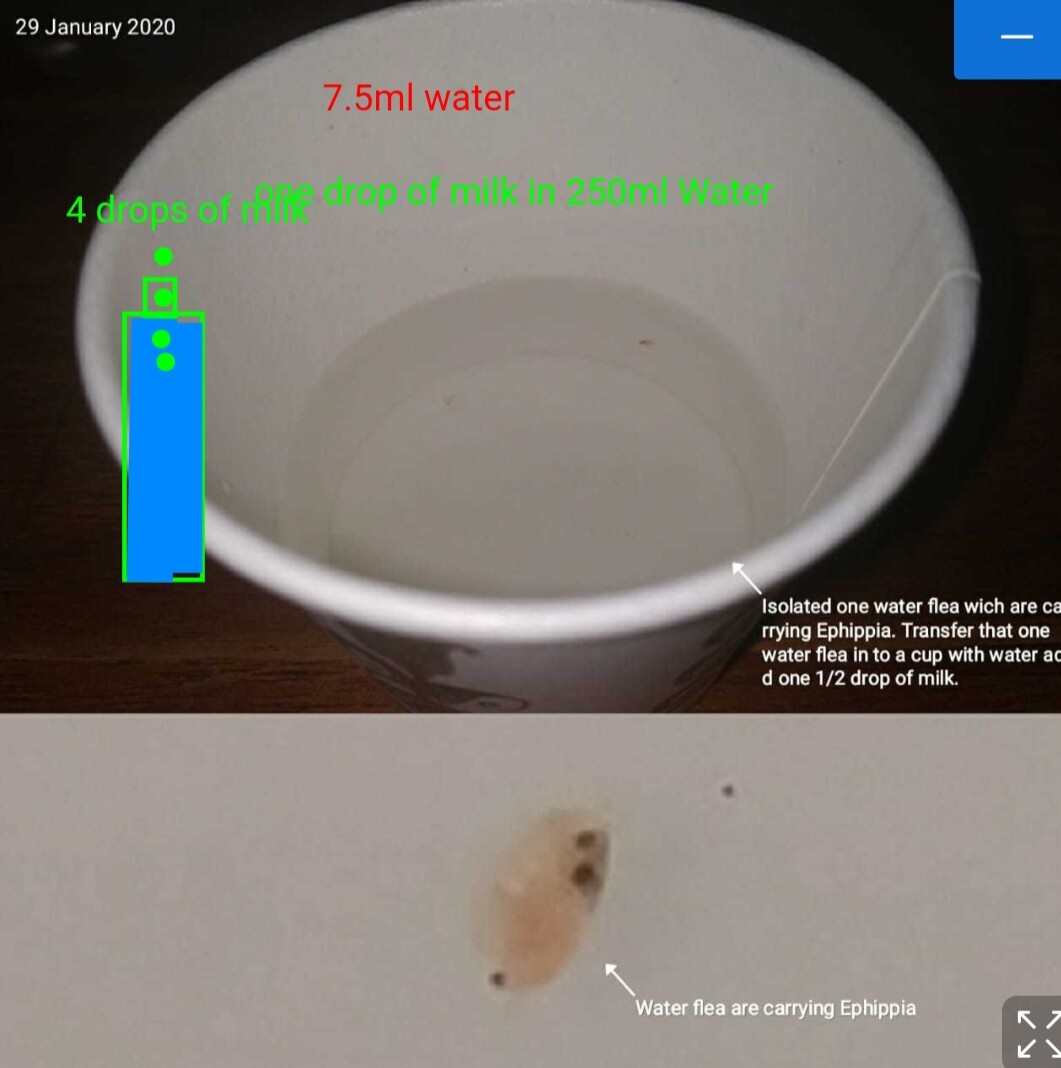
Aswathy got water fleas from one of the Fish farm and fortunately she has got some water flea carries Ephippia, is’nt that Amazing…
Having Ephippia reflects that water fleas has undergone some kind of unfavorable conditions/strees condition and switch there mode of reproduction from asexual to sexual mode due to gene manipulation…
And there’s a chance to get Male water flea hatch out of this Ephippia…
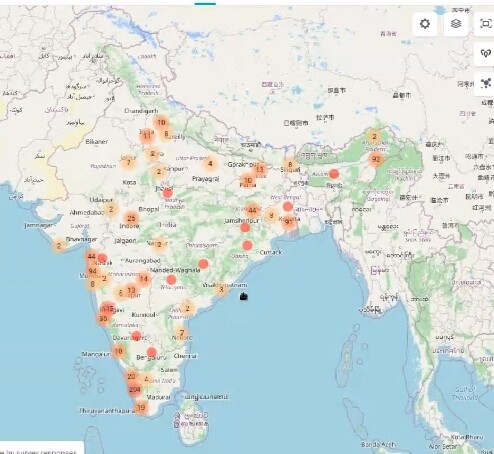
Mango-Mapping workshop
Congratulations to all as we all have been successfully added 1000 data and plot all of them in this map…
Let’s make some analysis, interpretation and try to make Hypothesis.