Yes we can create a flow chart to give yes or no answer.
@pratittodkar lets go step by step in a simple manner, can you spell out what was the readings of RGB for each of these concentrations?
Were the reading corellating with the concentration?
If so can we with sureity say which application is working well, so that others can also take help from it?
Why not show the readings and explain how are you converting RGB values into absorbance? what is the explanation behind it?
I dont understand what is known here as we are looking if the application of colorimeter is working or not! why not show the graph which you drew, or else we will end up in confusing everyone.
why not show exactly how did you take the reading, why not share the photograph of your experimental setup?
what do you mean by light source here, are you also giving a light source in your design?
please explain steps involved in your experimental design?
2 Likes
I took only R readings since G and B didn’t matter for the calculations.
R = 182
R = 178
R = 175
Yes they were as you can see the R readings are decreasing with increase in concentration and the opposite happened to G readings which I don’t have since I only took R readings for calculations.
Well absorbance is measured relatively so by it’s definition it is measured by dividing the intensity of solution with any concentration of absorbent by the Intensity of solution with 0 concentration of absorbent. Here we use the log function to get the values mostly between 0 and 1 though can values can be >1 i.e. To reduce it’s range. since we would like to have a defined scale where 0 is no absorption [ In this case that means the solution is the colour of the chair as seen through zero concentration solution ]. Hence the use of the logistic function - log (I / I0)
Here I just substitute the above values and get the results after noting observations.
The thing that is known here is the concentration of the solution for which we are going to find concentration using the app. Then we compare the known value with the found value to check accuracy.
I didn’t actually need to plot the graph using 2 point form equation of a line I used
( X1 = 0 concentration Y1 = 0 absorption)
( X2 = 0.05 concentration Y2 = 0.017033339 absorption)
Here the choice of points was random I could used the concentrations and absorption value of 0.01 concentration also.
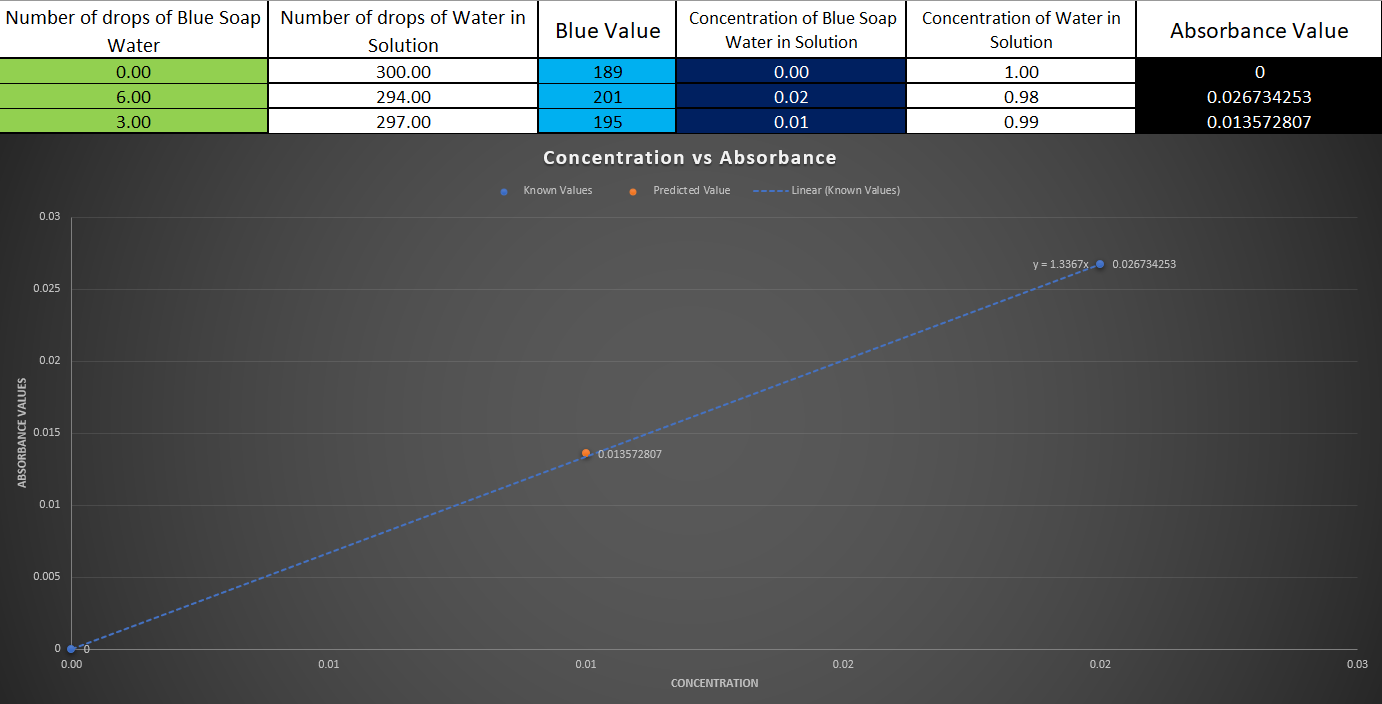
Then I got the equation given in the following picture.
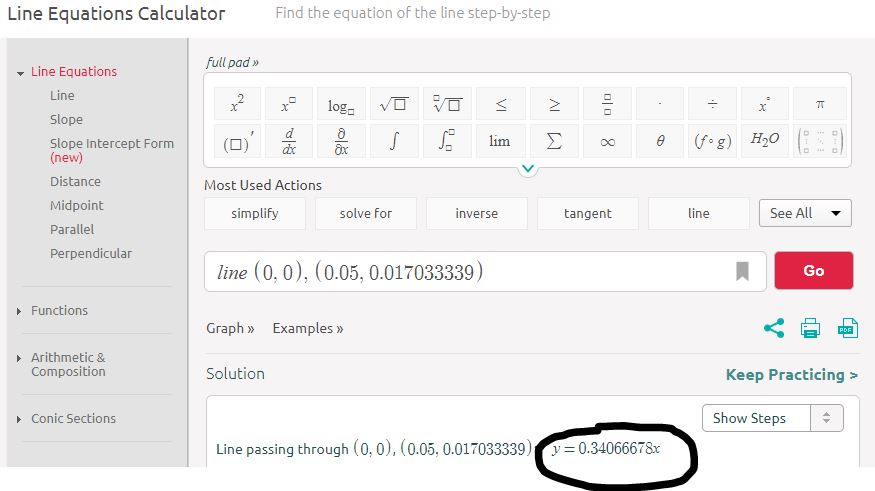
Using it I calculated the concentration for 0.009651386 absorption which was known by me to be 0.01
I substituted ( Y = 0.009651386 absorption)

This was all done without finding the best fit line. Using line of best fit we can get better estimate like in the image below.
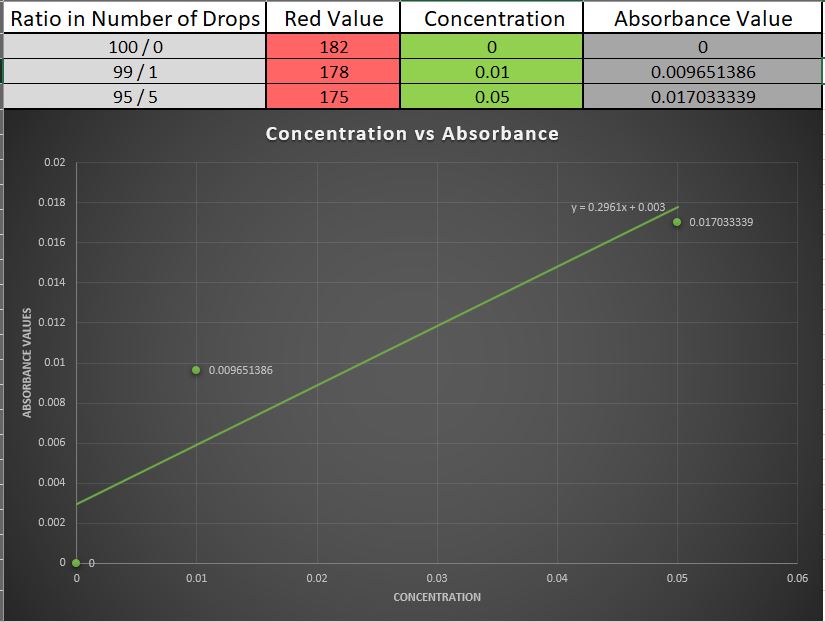
This was calculated by me just now I didn’t did this then since I didn’t had excel available there. Here you can also see the equation of the line. Here the estimate isn’t still accurate due to the very high probability that while I did the drop wise concentration I might have made some error in counting.
By light source I mean the light bouncing of the red coloured chair passing through the solution and coming out the other side.
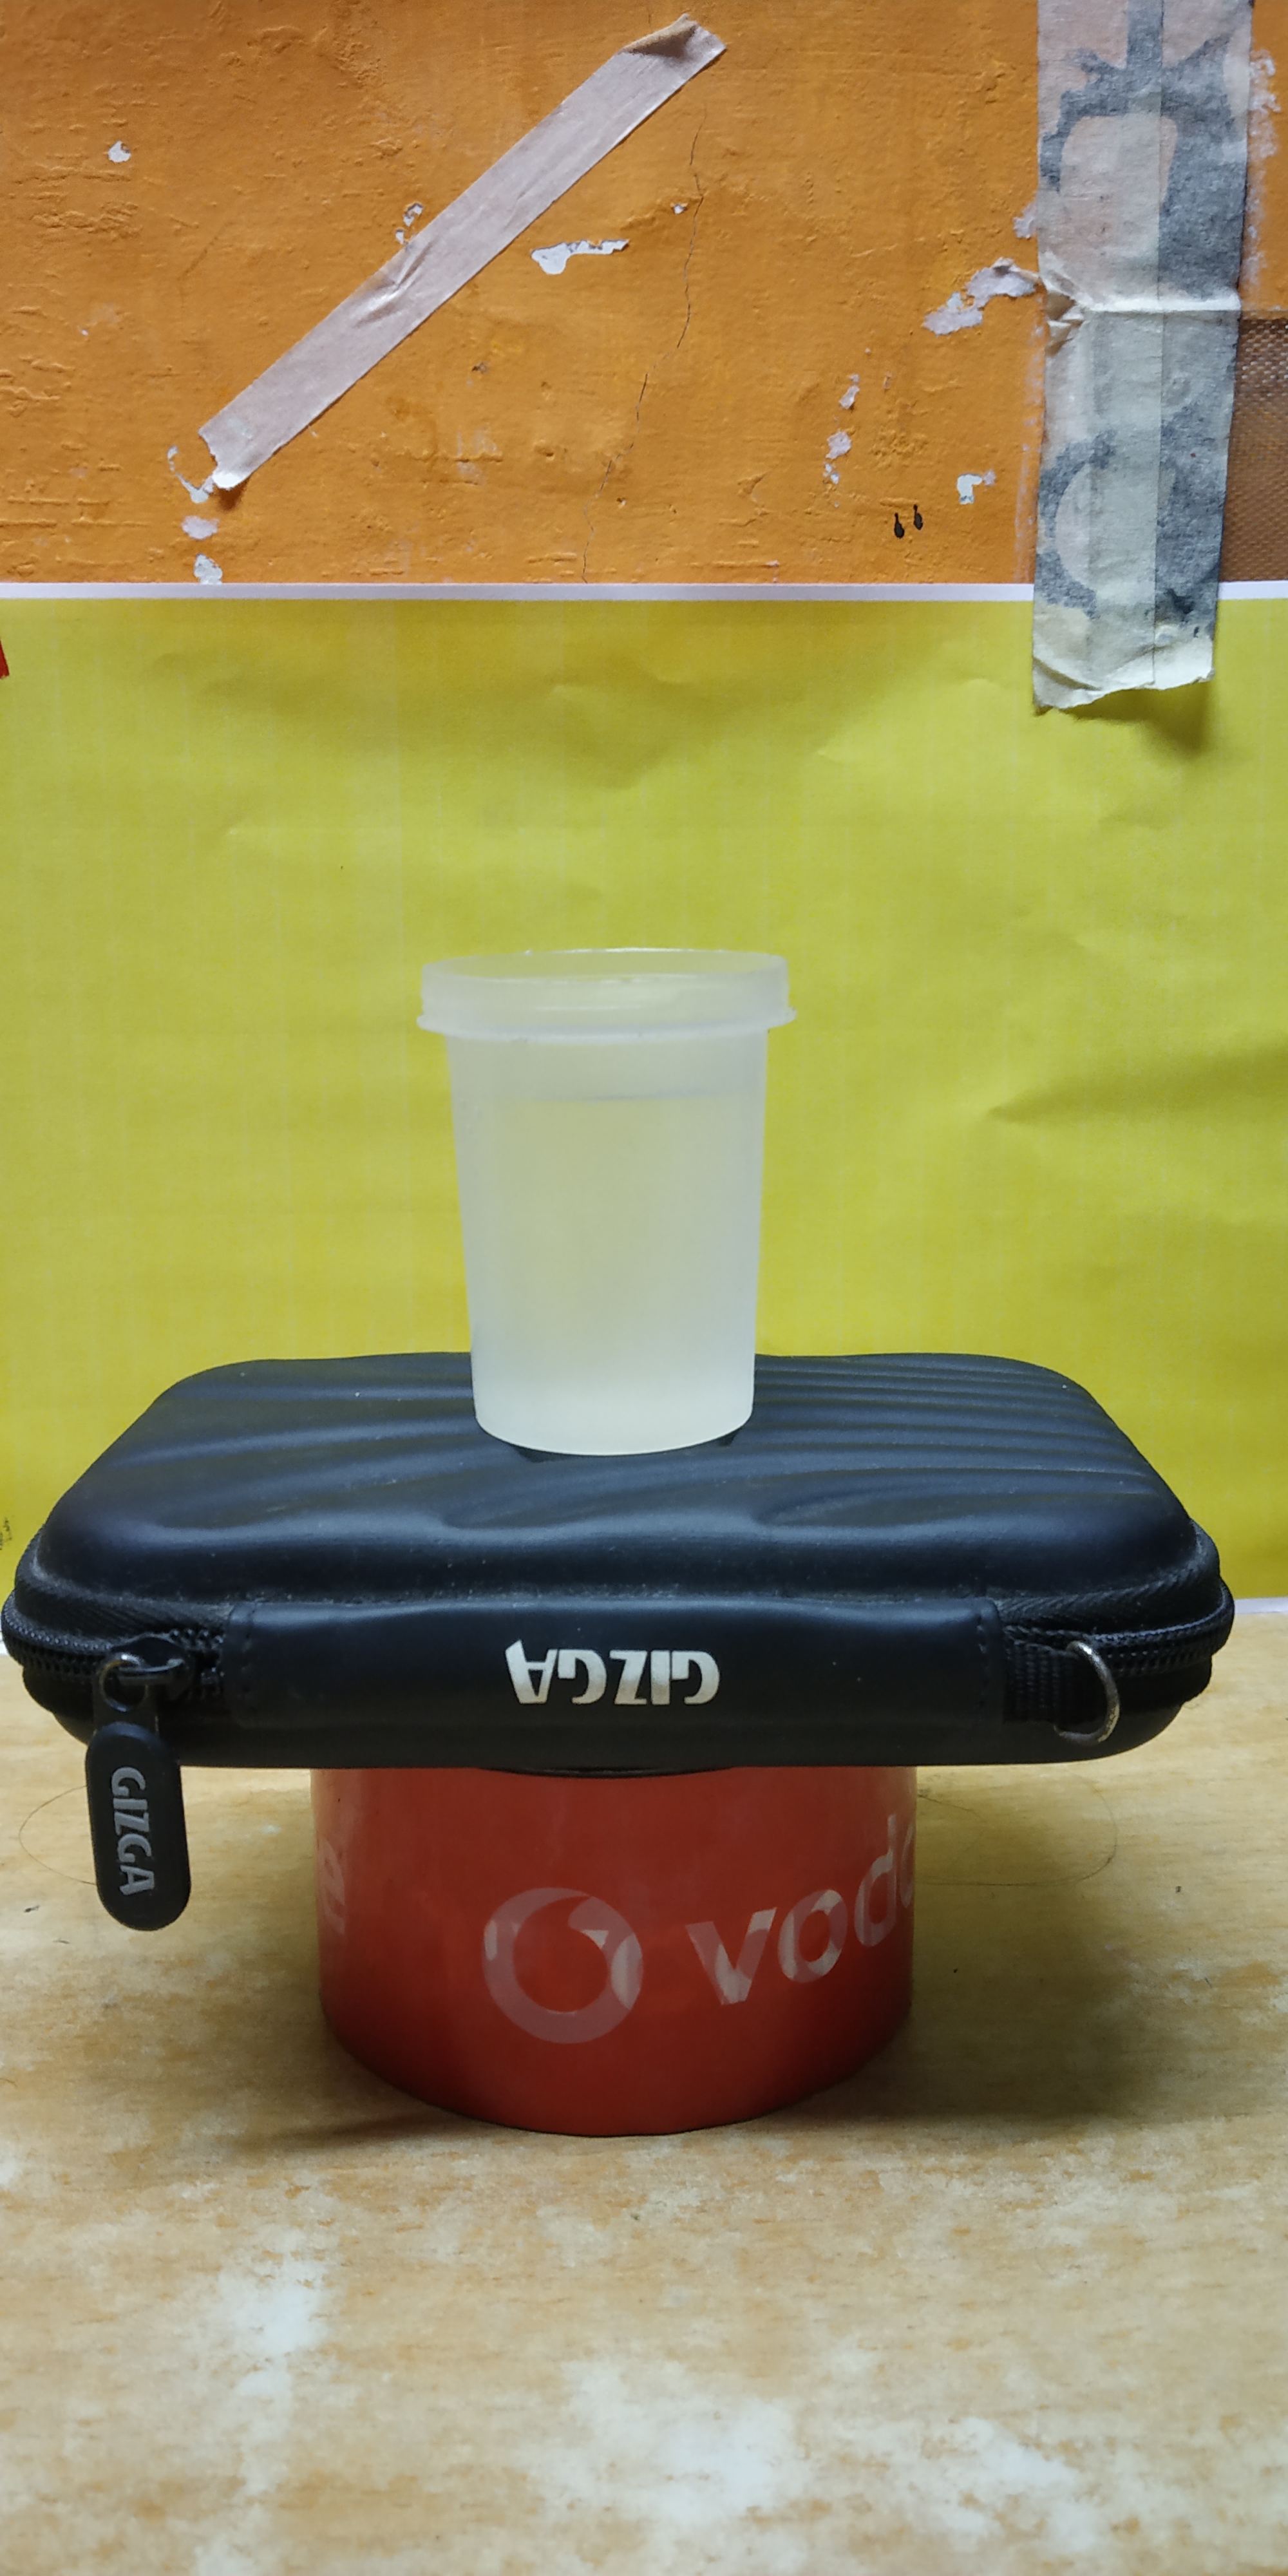
The steps involved are pretty simple just find a way anyhow to keep your camera stable in the front side of the solution and place the complimentary colour to your absorbent behind the solution.
I achieved this by placing the solution in front of the red backrest of the chair and placing my camera with the help of the duster in front of the solution so that it remains stable.
I am extremely sorry but I forgot to take the photo of the setup I can send one by recreating the same setup at my home. Will it be fine?
2 Likes
Please even share this on the WhatsApp groups…such big things need to be discussed everywhere so that more of people get to know about it.
3 Likes
While sharing it in other groups and other social media, do emphasise that the conversation developed here in STEMgames, which is open for all to come and share things that are serious and useful, and that people everywhere can actually work with. These things can be done, often enough at home, and at school, using commonplace daily things like smartphones.
And, importantly, it can be shared safely and sensibly in the STEMgames environment.
4 Likes
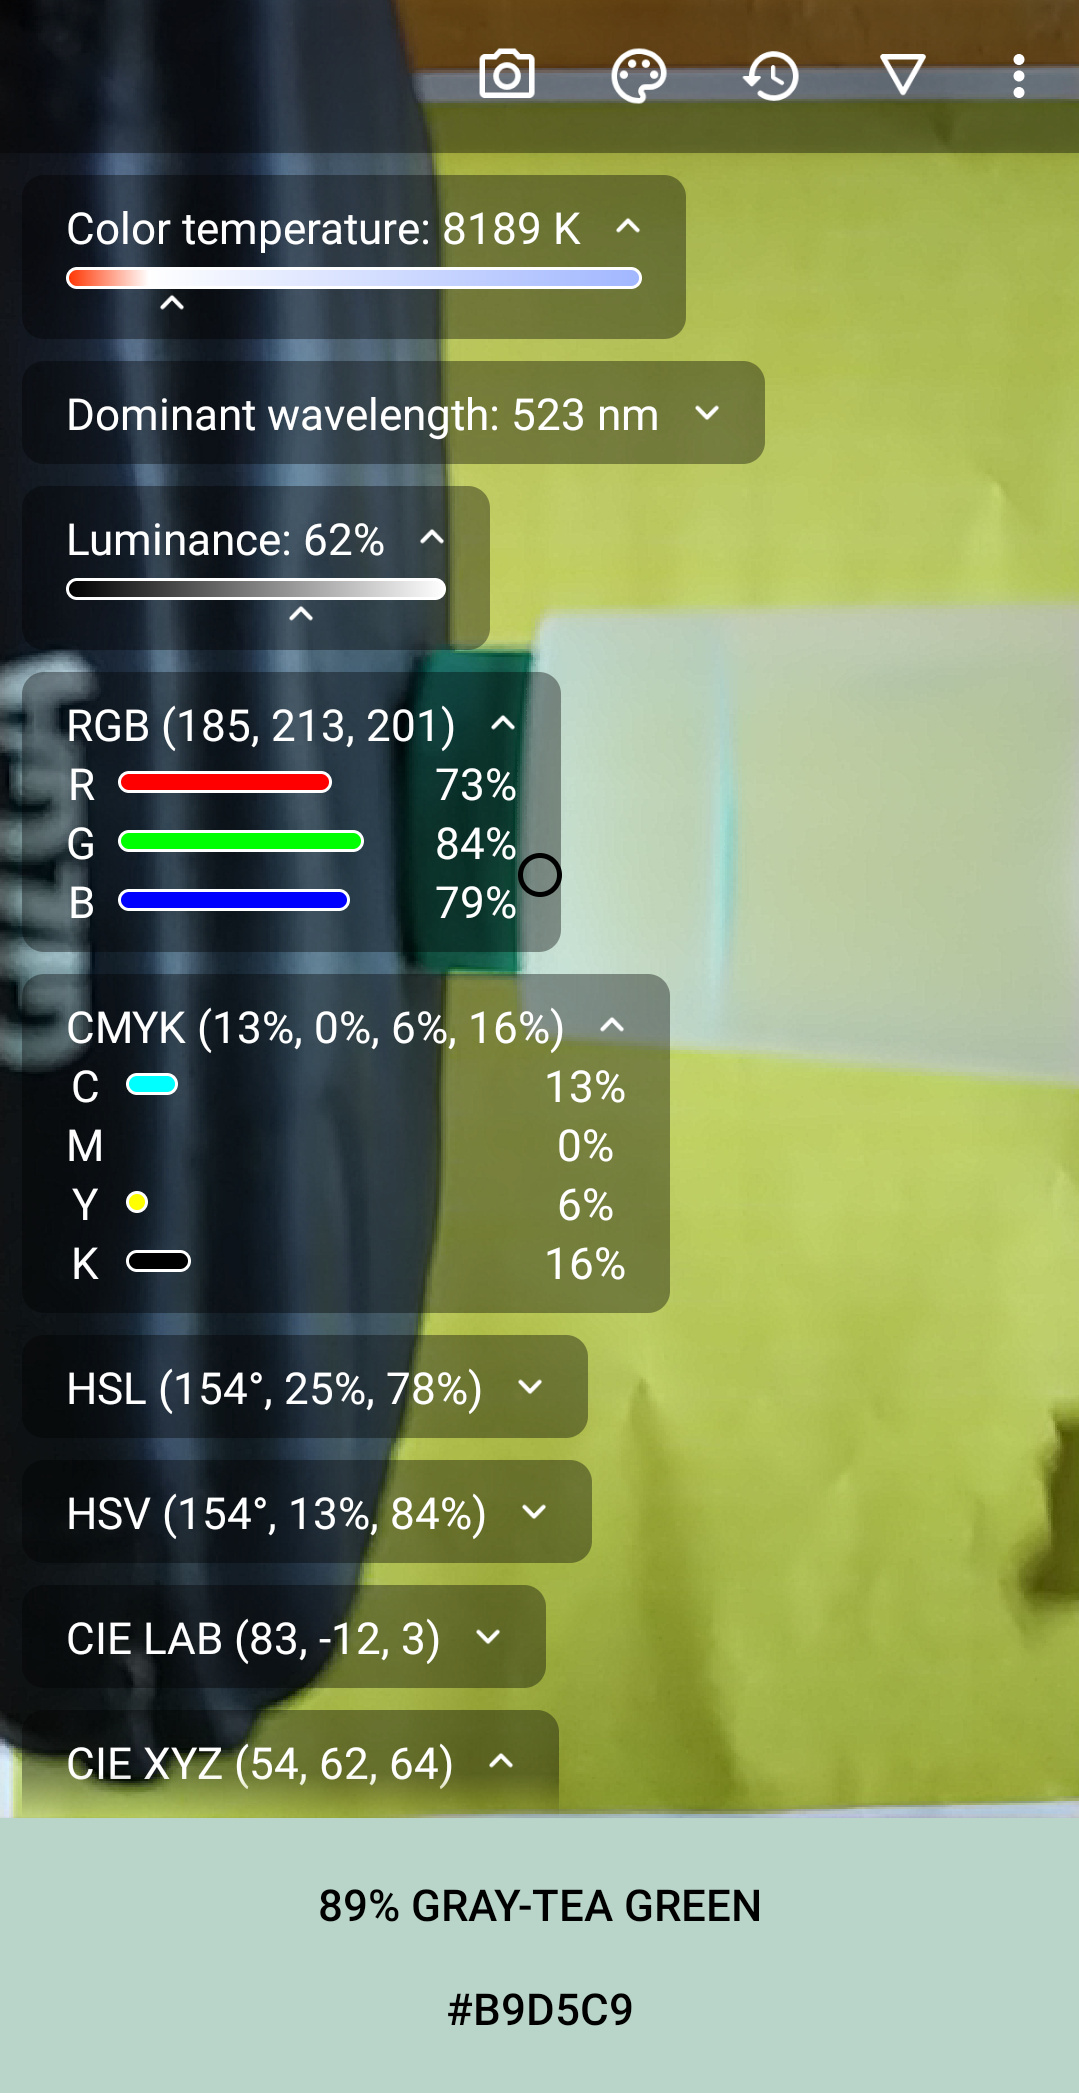
Colourimeter readings for 300:0 i.e. 0 concentration of blue colored soap water:
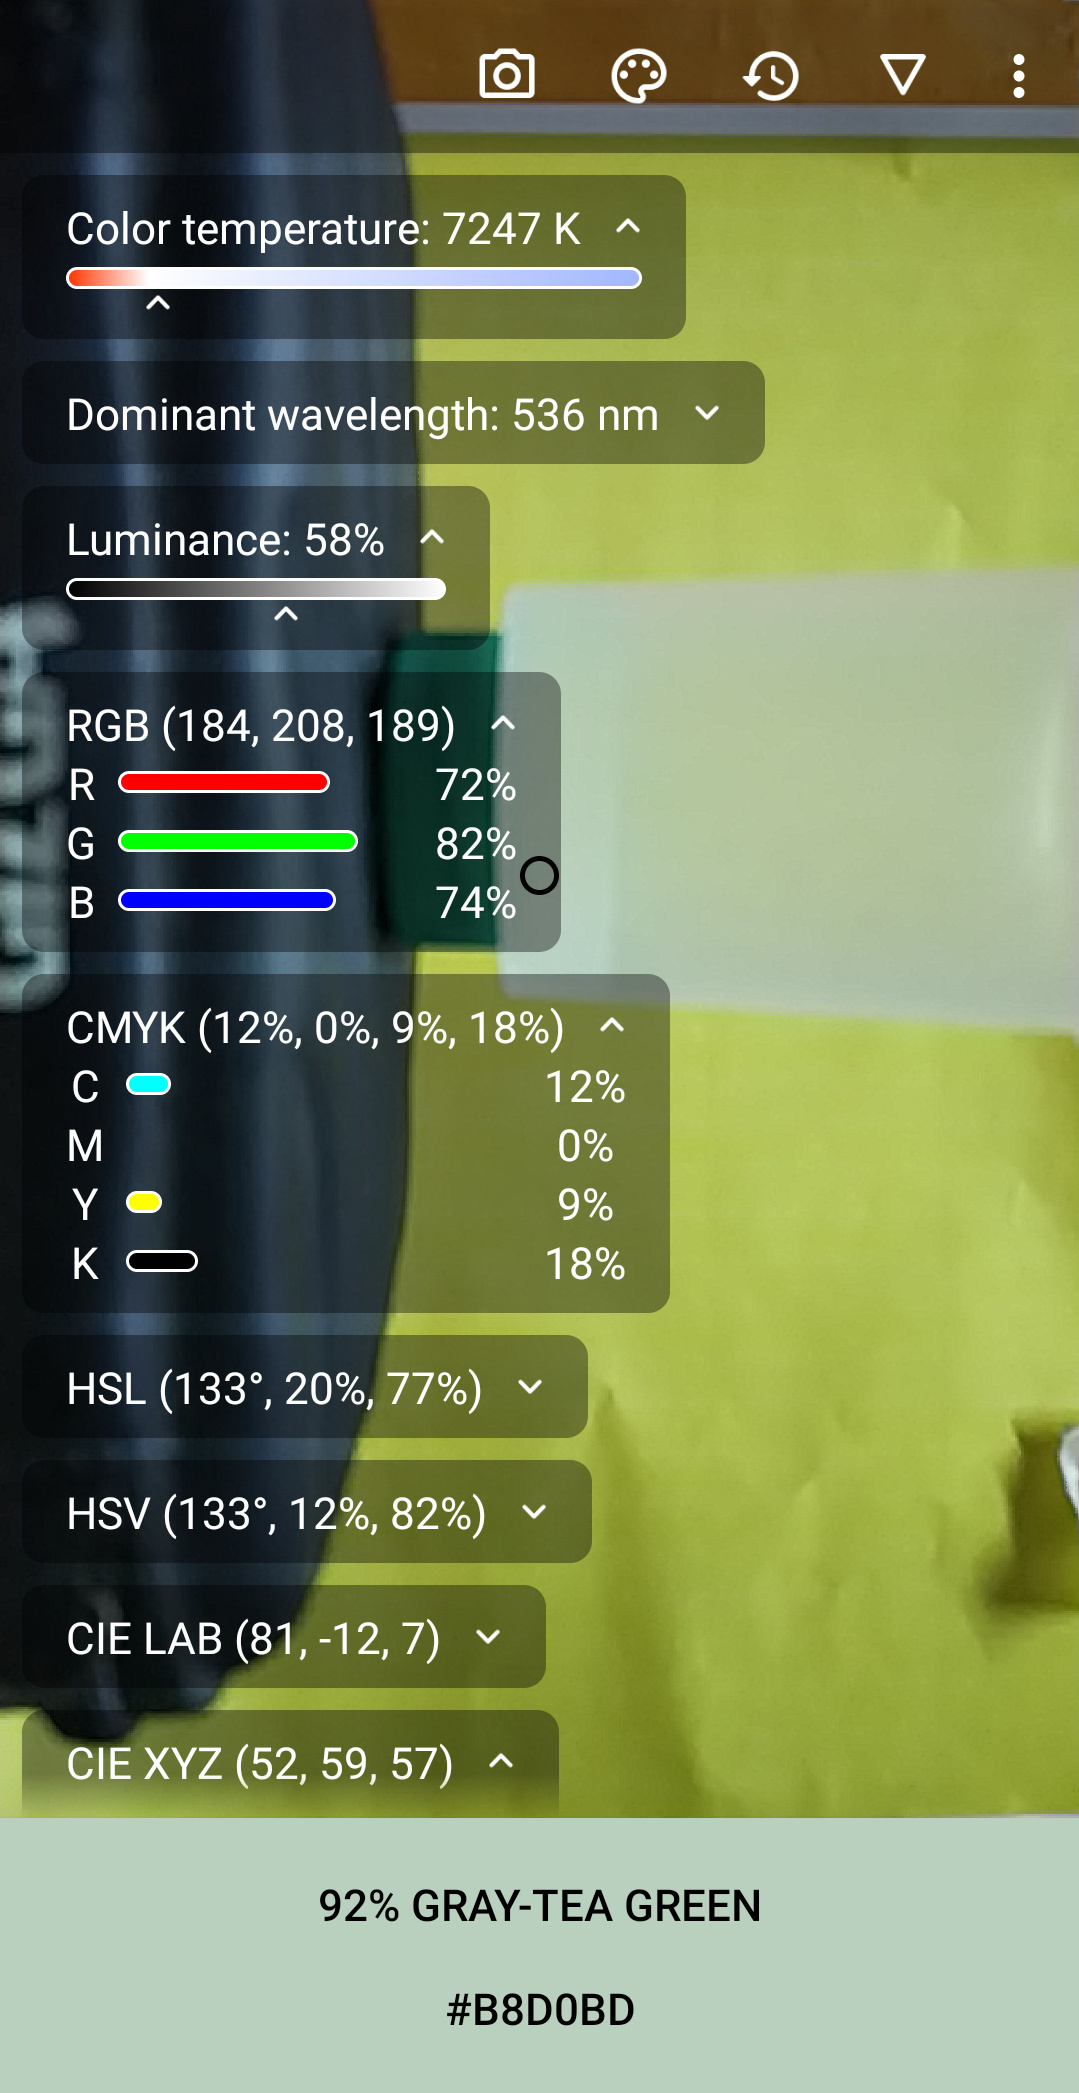
Colourimeter reading for 297:3 i.e. 0.01 concentration of blue coloured soap water:
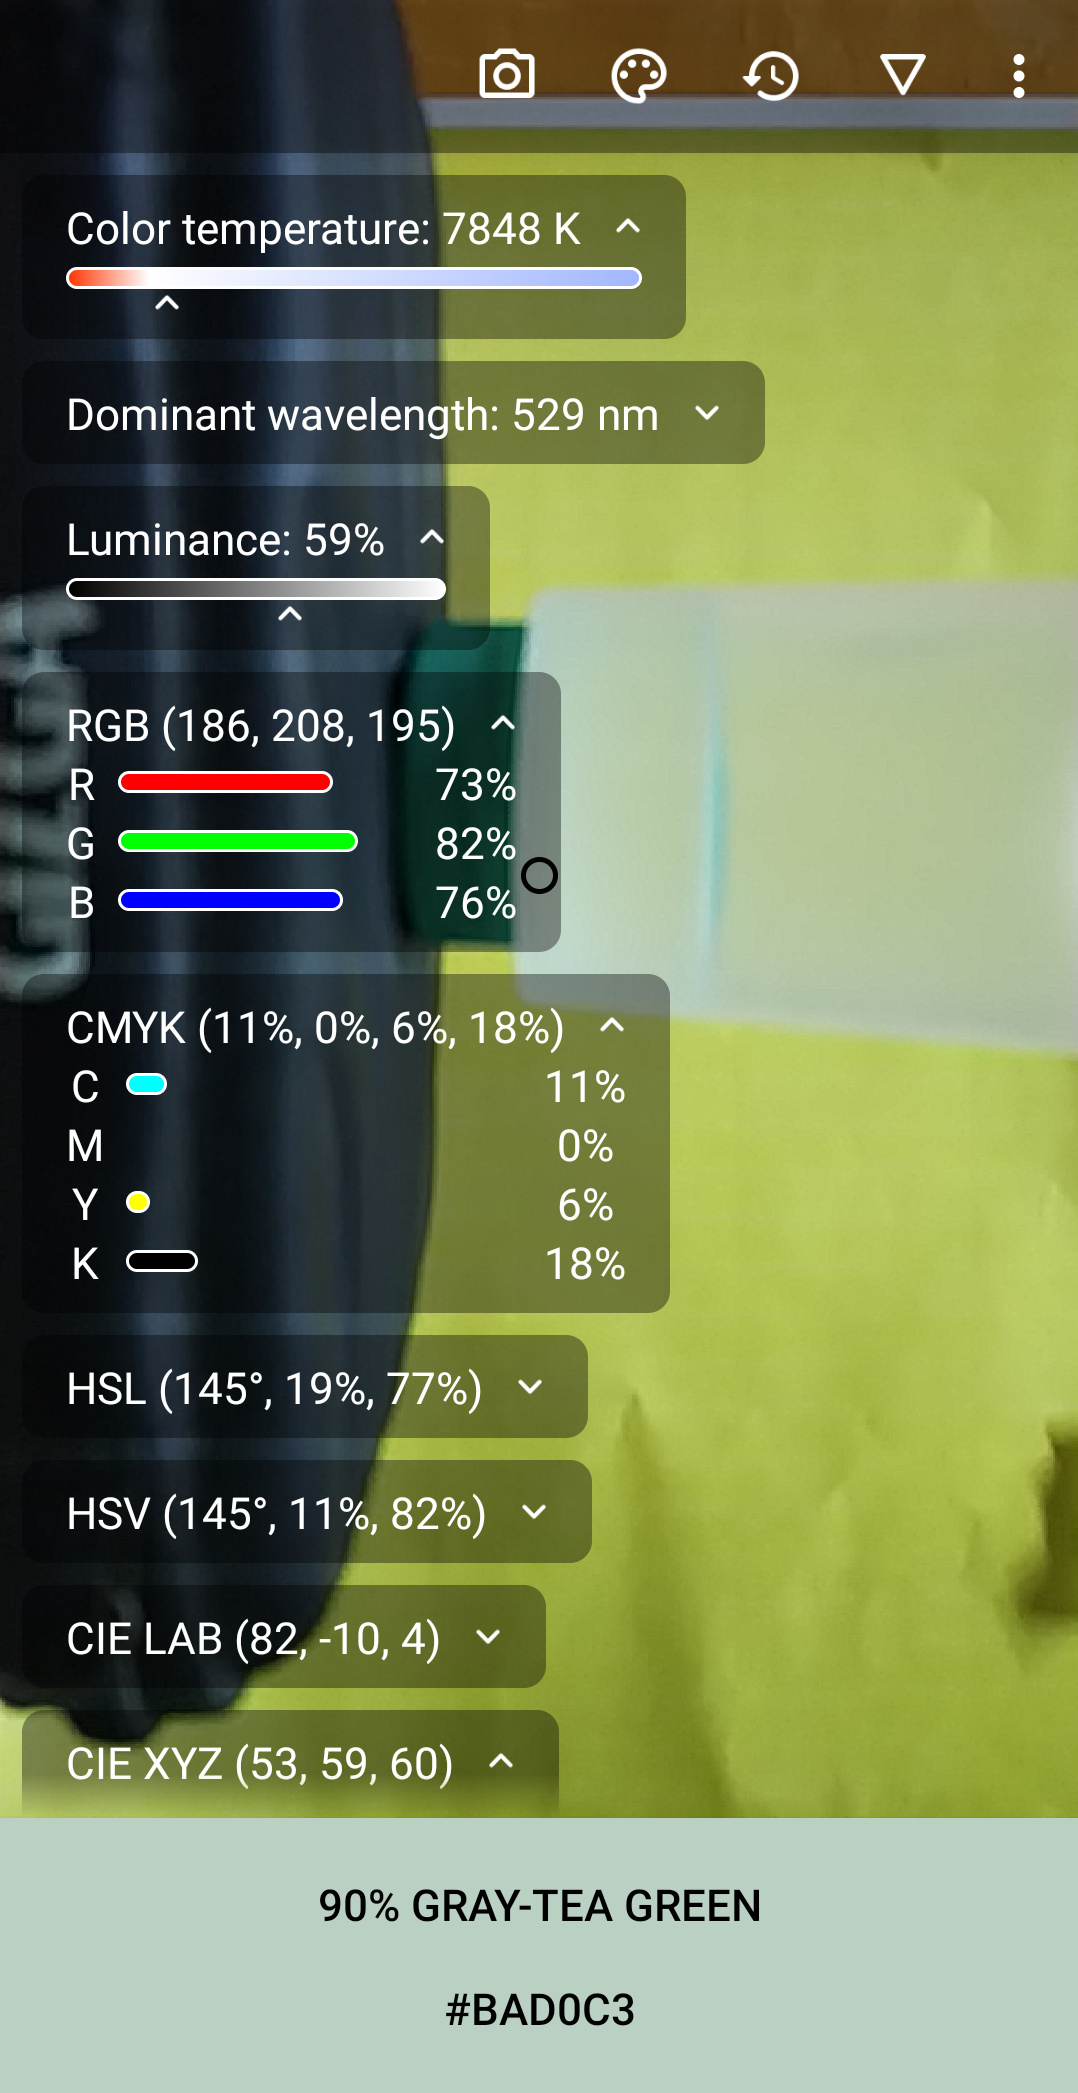
Colourimeter Reading for 294:6 i.e. 0.02 concentration of blue coloured soap water:
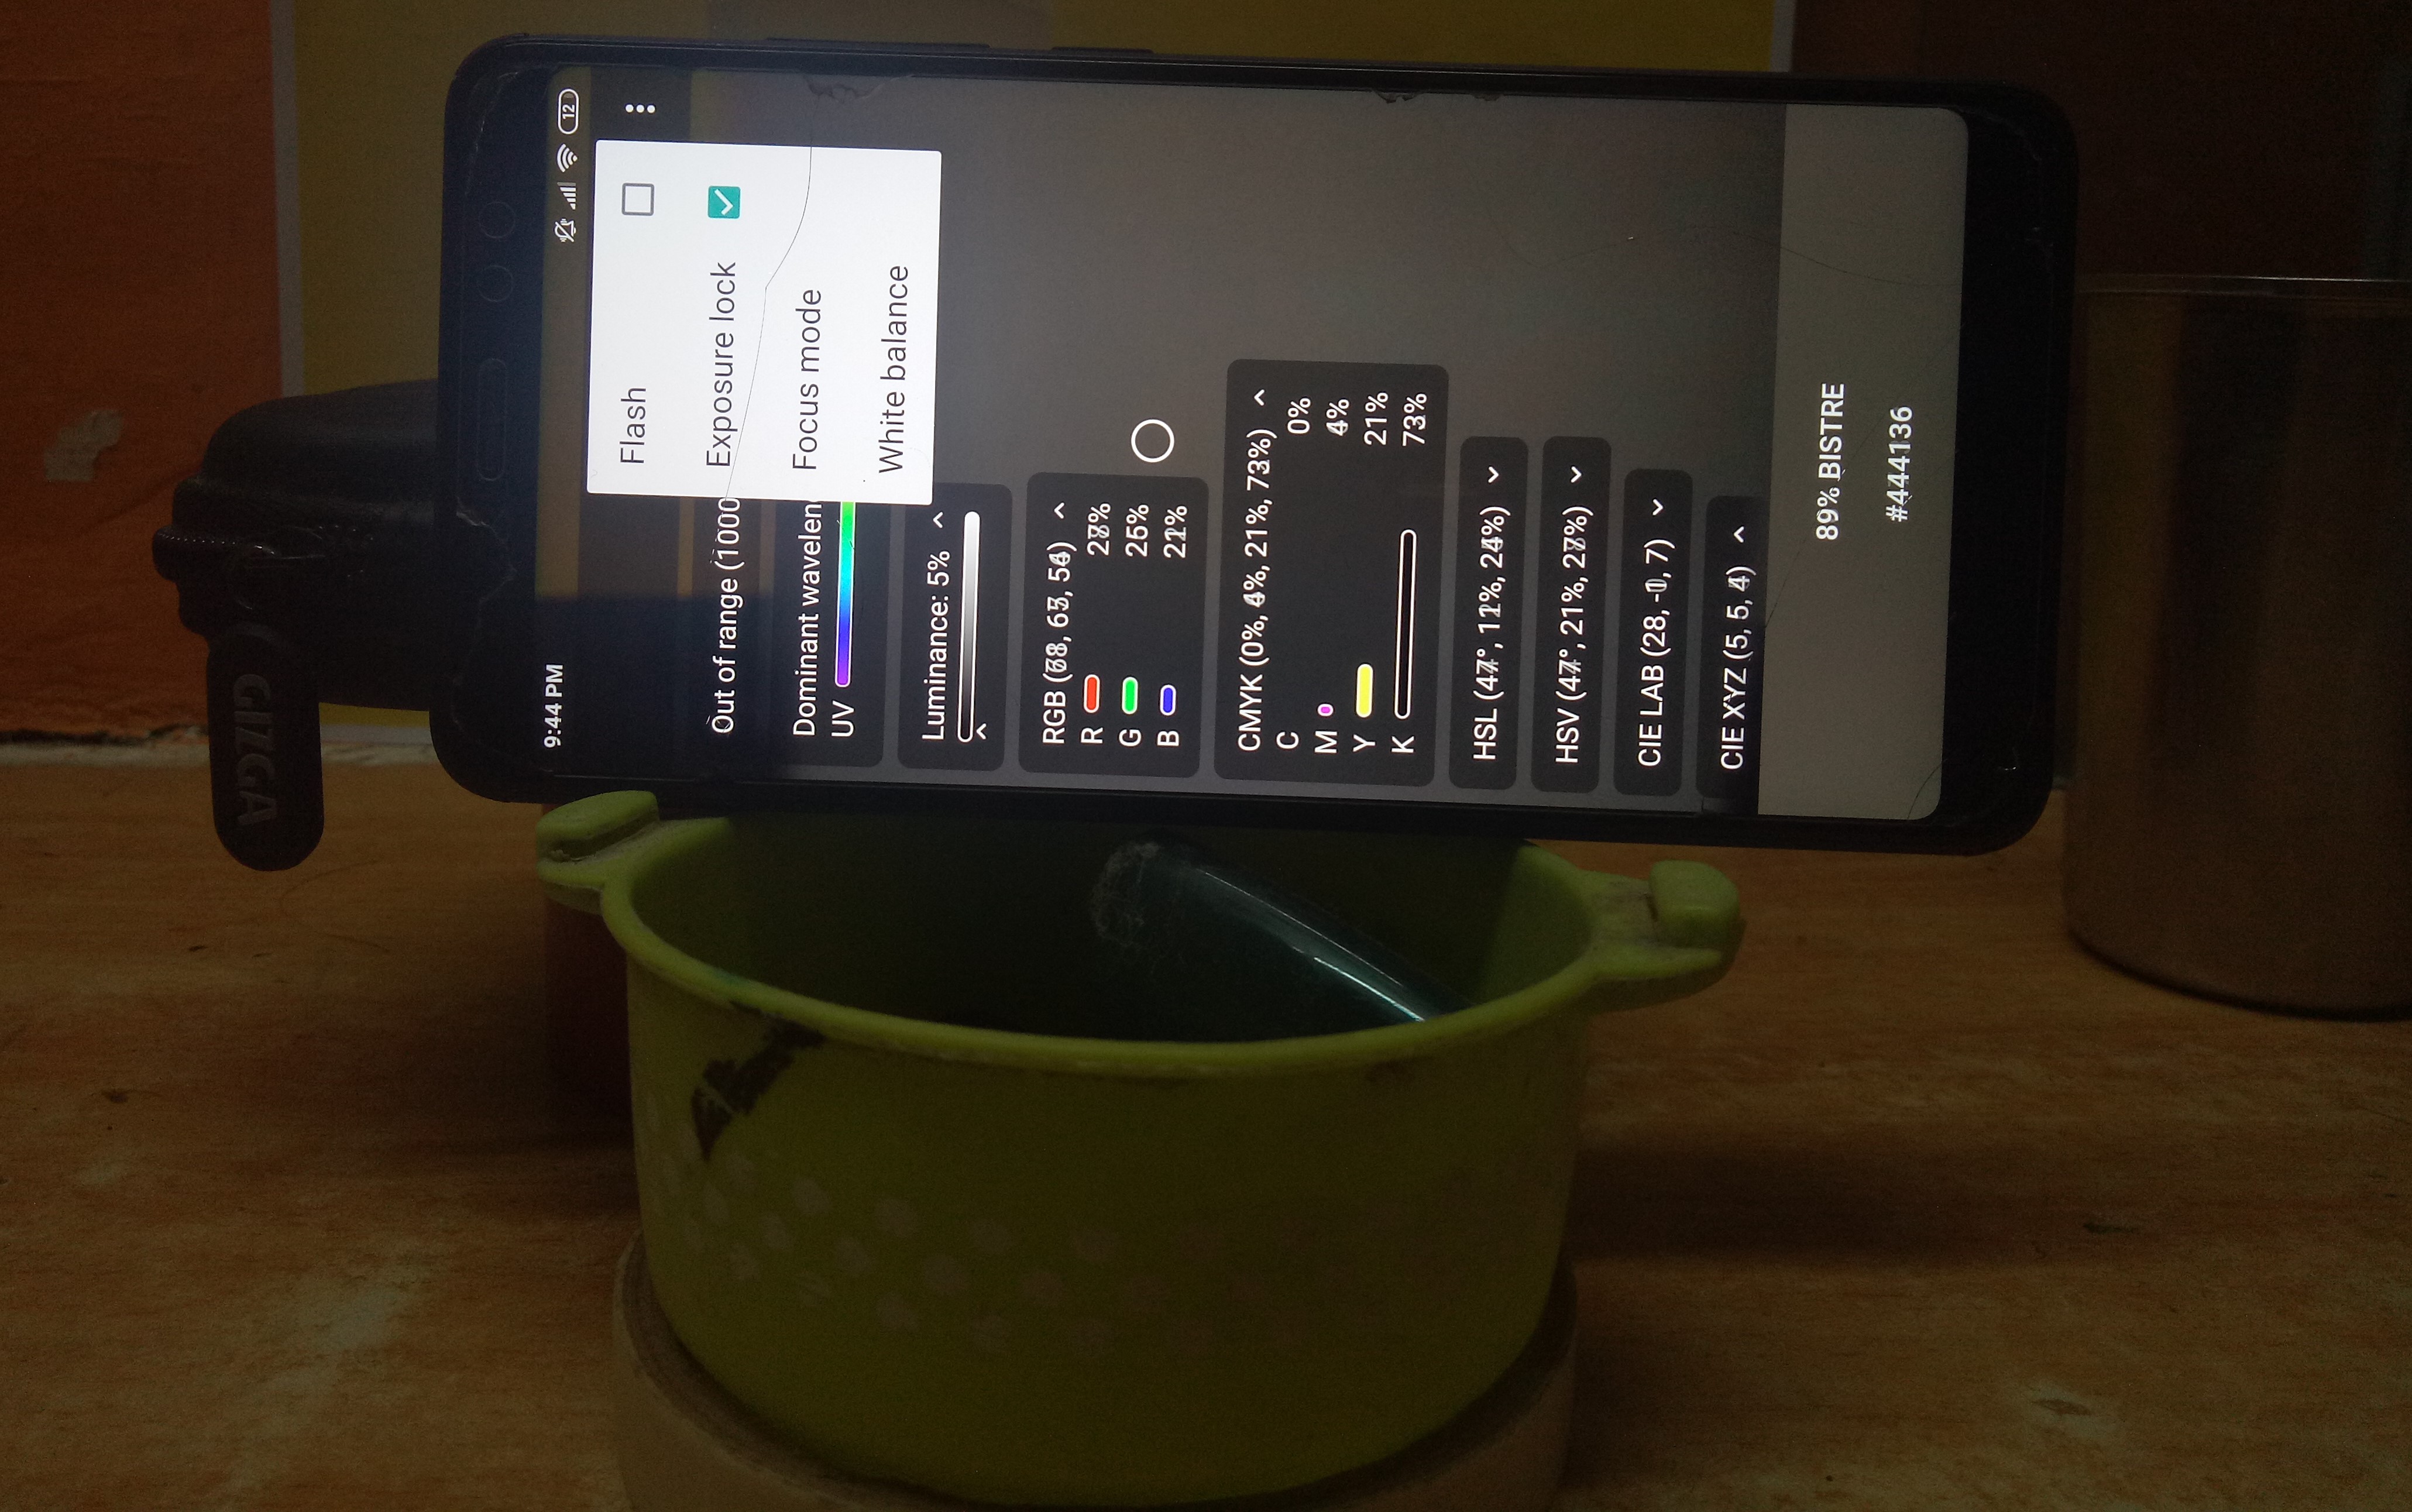
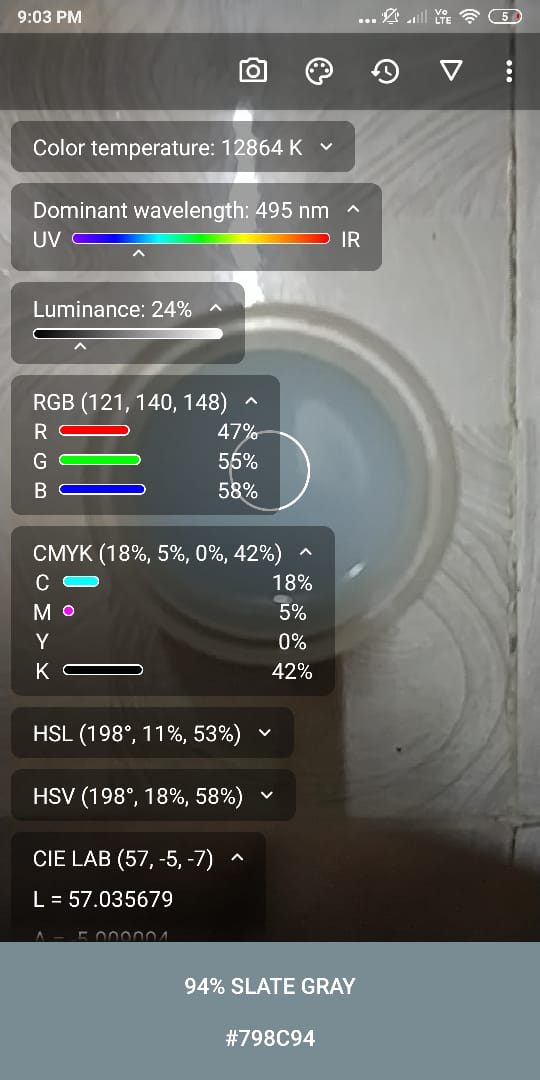
Setup (The second pick is darker because the camera adjusted to the excess light given out by the mobile screen) :
The math is same as explained above and here I measured the blue color which is reflected instead of yellow because it was easier to do so and that is why I haven’t taken the negative of the log but instead it’s actual value i.e.
Instead of A = -log [ ( Absorbed Color Value Zero Concentration ) / ( Absorbed Color Value Current Concentration ) ] .
I did A = log [ (Reflected Color Value Zero Concentration )/ (Reflected Color Value Current Concentration) ].
@jaikishan @Arunan I will post some more explanation in some more time on whats app as well as this website.
My Setup is crude. It was created just enough sturdy to accomplish the task. One can create cardboard box for the mobile as well as the container stand.
2 Likes
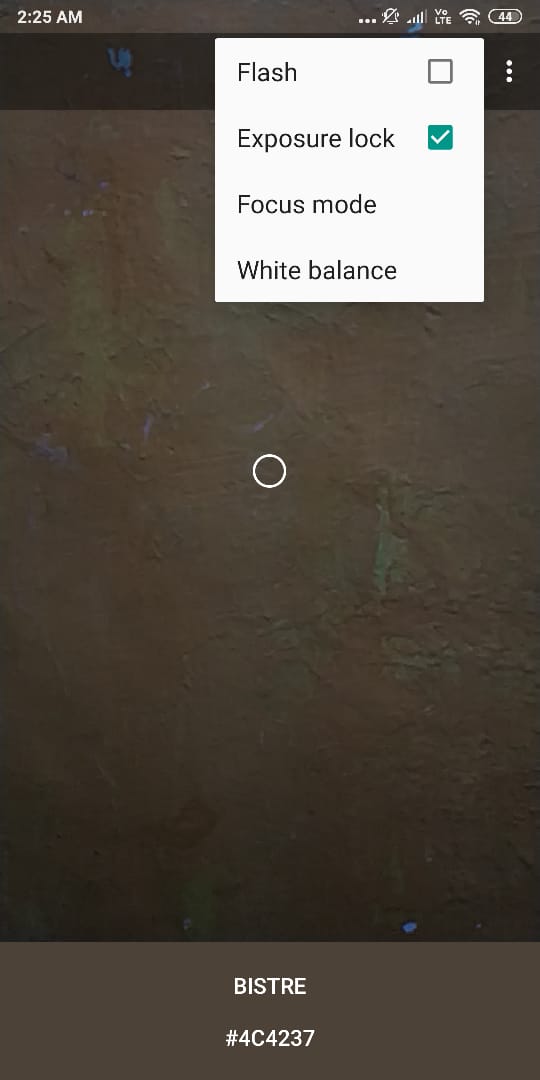
The fluctuations in the values obtained due to the constant change in the camera optimization due to mobile can be changed by doing the following things:
- Lock Exposer
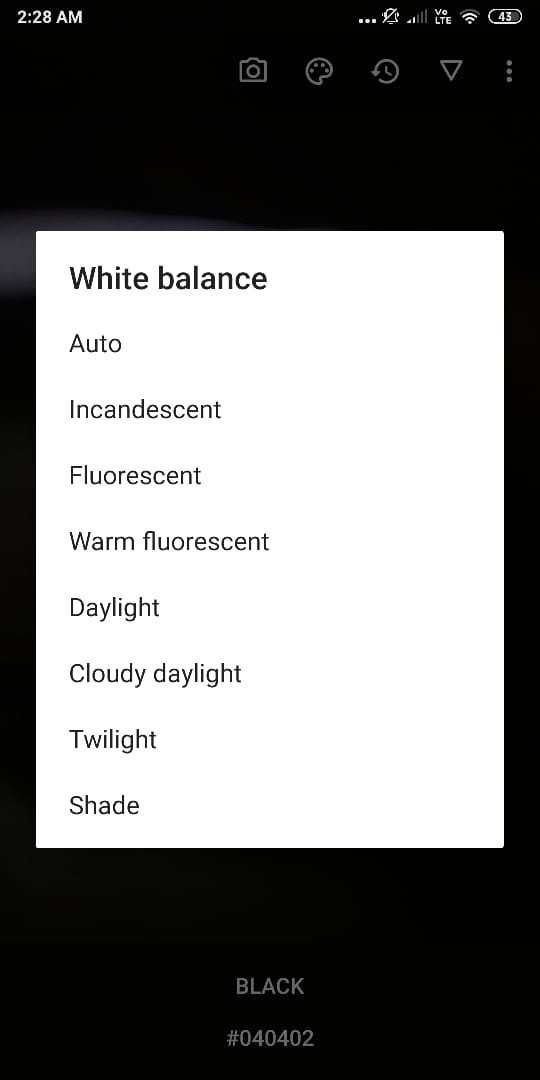
- Set Custom Fixed White Balance
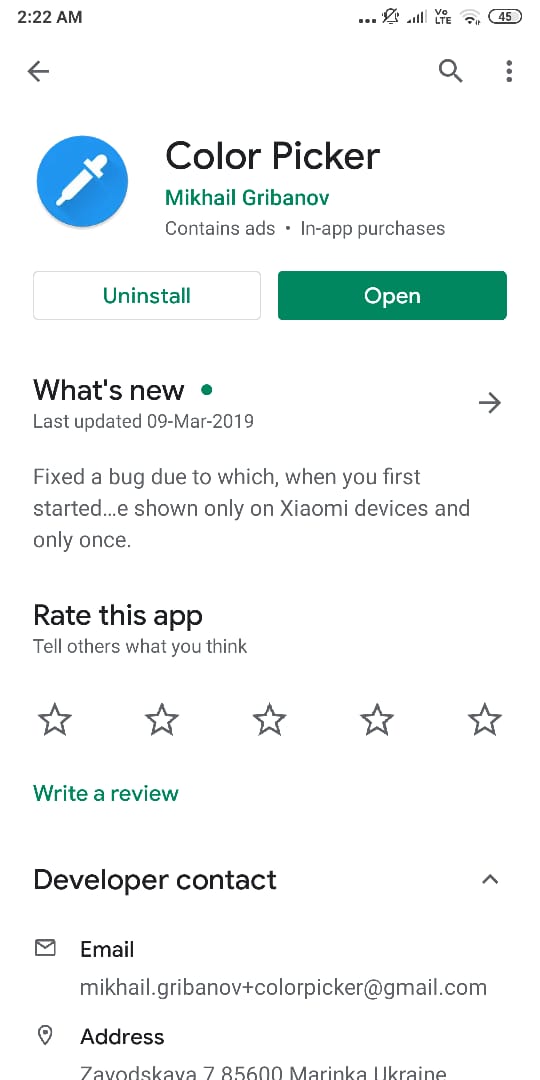
Steps for app usage:
-
Download the app. -
Open the app -
Click on the camera icon and tick exposure lock option while pointing at your setup. -
Select any of them according to your light source. -
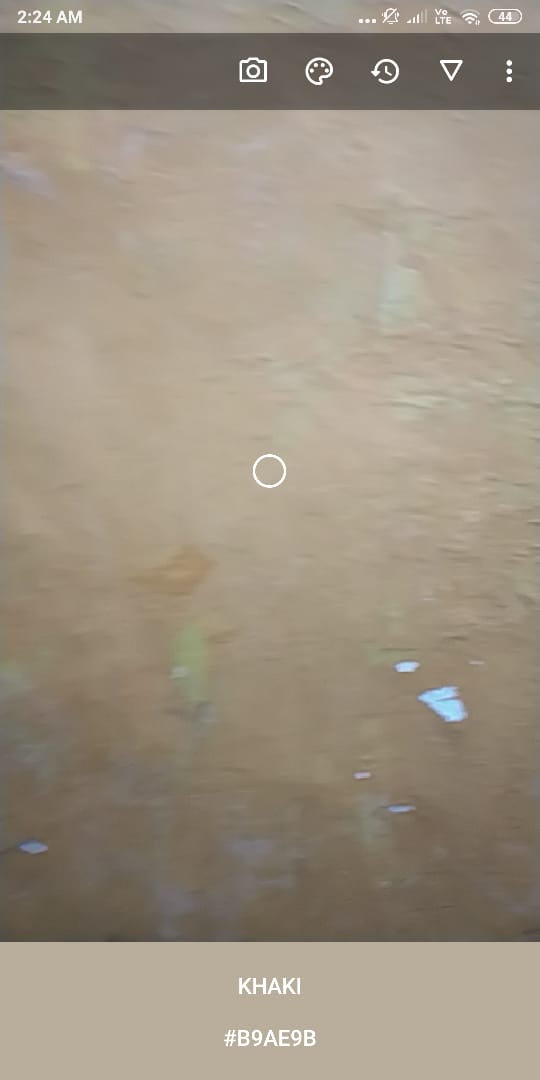
Click on the triangle symbol on the upper right corner. - Then you can setup your camera so that the circle in the middle of the screen lien in the colour you are measuring
There will always be fluctuations of ±1 so don’t worry about it and ignore. Just note down the reflected colour value.
Can’t understand anything, Please tell your objective, first. @pratittodkar
1 Like
@dialecticalbiologist it’s the same thing as above to verify whether we can use colorimeter created out of a mobile app with inaccurate color values to get accurate concentration readings of any substance by using relative colour values rather than accurate color values.
@dialecticalbiologist refer to this post for the principal behind the work
@pratittodkar please explain the principle of colorimetry in your language as if you are explaining to a junior student! Urgent!
3 Likes
@dialecticalbiologist The principle of colorimetry is that if a particular substance can absorb a specific amount of light then the more the substance the more will be the light absorbed. Hence light absorbed is proportional to the amount of substance.
If we can figure out that above mentioned correlation for a substance then we can measure the emitted light after passing through the substance or of the substance for the intensity of color absorbed then we can determine the amount of substance present in a solution.
The process of getting the correlation (calibration) and doing the measurement (estimation using correlation) is part of the process we call a colorimetry test and the correlation is the principle behind getting the estimation using colorimetry. Without the principle there is no estimation.
There are two major principles at work. The principle behind the tech (Colorimeter machine) and the process (colorimeter test). What I have mentioned above is the principle of the test.
1 Like
Why not explain this with an example? URGENT @pratittodkar
1 Like
Please continue! It’s long since you started the project. Lets proceed and come up with some ‘product’ while describing the ‘process’! @pratittodkar
3 Likes
“Lets proceed and come up with some ‘product’ while describing the ‘process’!” This is a statement that distinguishes other project based STEM education programs and STEMGames. Process, the designThnking and Tinkering that happens through dialog!
2 Likes
The process of calibration is simple:
- Take a test tube filled with the medium in which the substance whose concentration you have to measure will be suspended. This will be the “zero” since it has zero concentration of the substance we are trying to measure.
- In a traditional colorimeter you adjust some dials so that the absorbance value is zero. But in the one we are designing we have to see what the turning of those dials does and do it ourselves manually.
- This is where the Beer-Lambart’s law comes in. We point our device at the test tube with zero concentration and then measure the intensity of the colour that has the most absorbance out of Red, Green or Blue.
- After getting a number between 0-255 for the intensity of that particular colour we write it down and calculate absorbance using the formula Absorbance = -log(I / I0). I is intensity for current measurement and I0 is the intensity for our “zero” measurement. The answer to this will be 0 since I0 = I.
- When we adjust the dial in the traditional colorimeter we are actually adjusting the I0 so that it matches I and the answer for absorbance displayed by the device becomes 0.
The process of getting the correlation:
- We then measure the absorbance for some known concentrations after adjusting the “zero”.
- We plot this measurements on a graph. This gives us a linear relation between absorbance and concentration.
- This graph is the correlation we found. It could be shown in the form of a equation too if we get the equation for the line.
The process of measurement:
- After getting the relation we use it to find unknown concentration. We can get the absorbance from the device and calculate concentration from the equation for the line which is our correlation.
1 Like
The product is actually ready all we need to do is some testing. The app is ready too. It just needs to be tested in serious experiments. I know or rather I pretty much believe it works but science doesn’t works that way it needs proofs but I am currently in middle of my preliminary exams for 12th std so I can’t invest any time currently in it.
4 Likes
Let’s return to this after your exams.
3 Likes
This will be a really useful project!
1 Like
Just to remind the discussion, the dialogue has discovered some really cool ways of using fuzzy but cheap and everyday technologies to identify something with surety and speed, that otherwise needs a lot of time, expert knowledge and expensive gear.
The ‘something’ in this case is falciparum malaria, a frequent killer disease that can often be treated effectively and efficaciously if identified in time, often a matter of hours from appearance of symptoms. I’m a falciparum survivor myself, so I have a little personal vesting in this.
I also have learned from malaria experts that the same disease, falciparum malaria, is a vicious killer in Africa, far worse than in India, where it is bad enough. That continent also has other diseases spread by similar insect vectors, such as tsetse fever, where again rapid testing could make a big difference. The need for a widely distributed test is huge, therefore.
What I haven’t understood from the work done so far is whether the reference colour sheet, the background for the test, is easily produced in an accurate shade, in a medium that will hold the colour fast for a decent period of time.
Has anyone participating here got experience of common printing techniques, who can throw…errrrr…light (not necessarily A Study In Scarlet😀) on this?
2 Likes