CUBE ChatShaala — Discussion Summary
Date: 10 May 2026
Today’s CUBE ChatShaala session centred on what the community fondly frames as the “Celebration of Goof-Ups” — a deliberate, structured space where student researchers share their errors, confusions, and unexpected findings openly, treating them not as failures but as the raw material of genuine inquiry.
Two cubists, Niharika and Sailekshmi, presented their ongoing nail-growth tracking experiments, and the discussion that followed turned out to be one of the richest learning conversations the group has had in recent weeks.
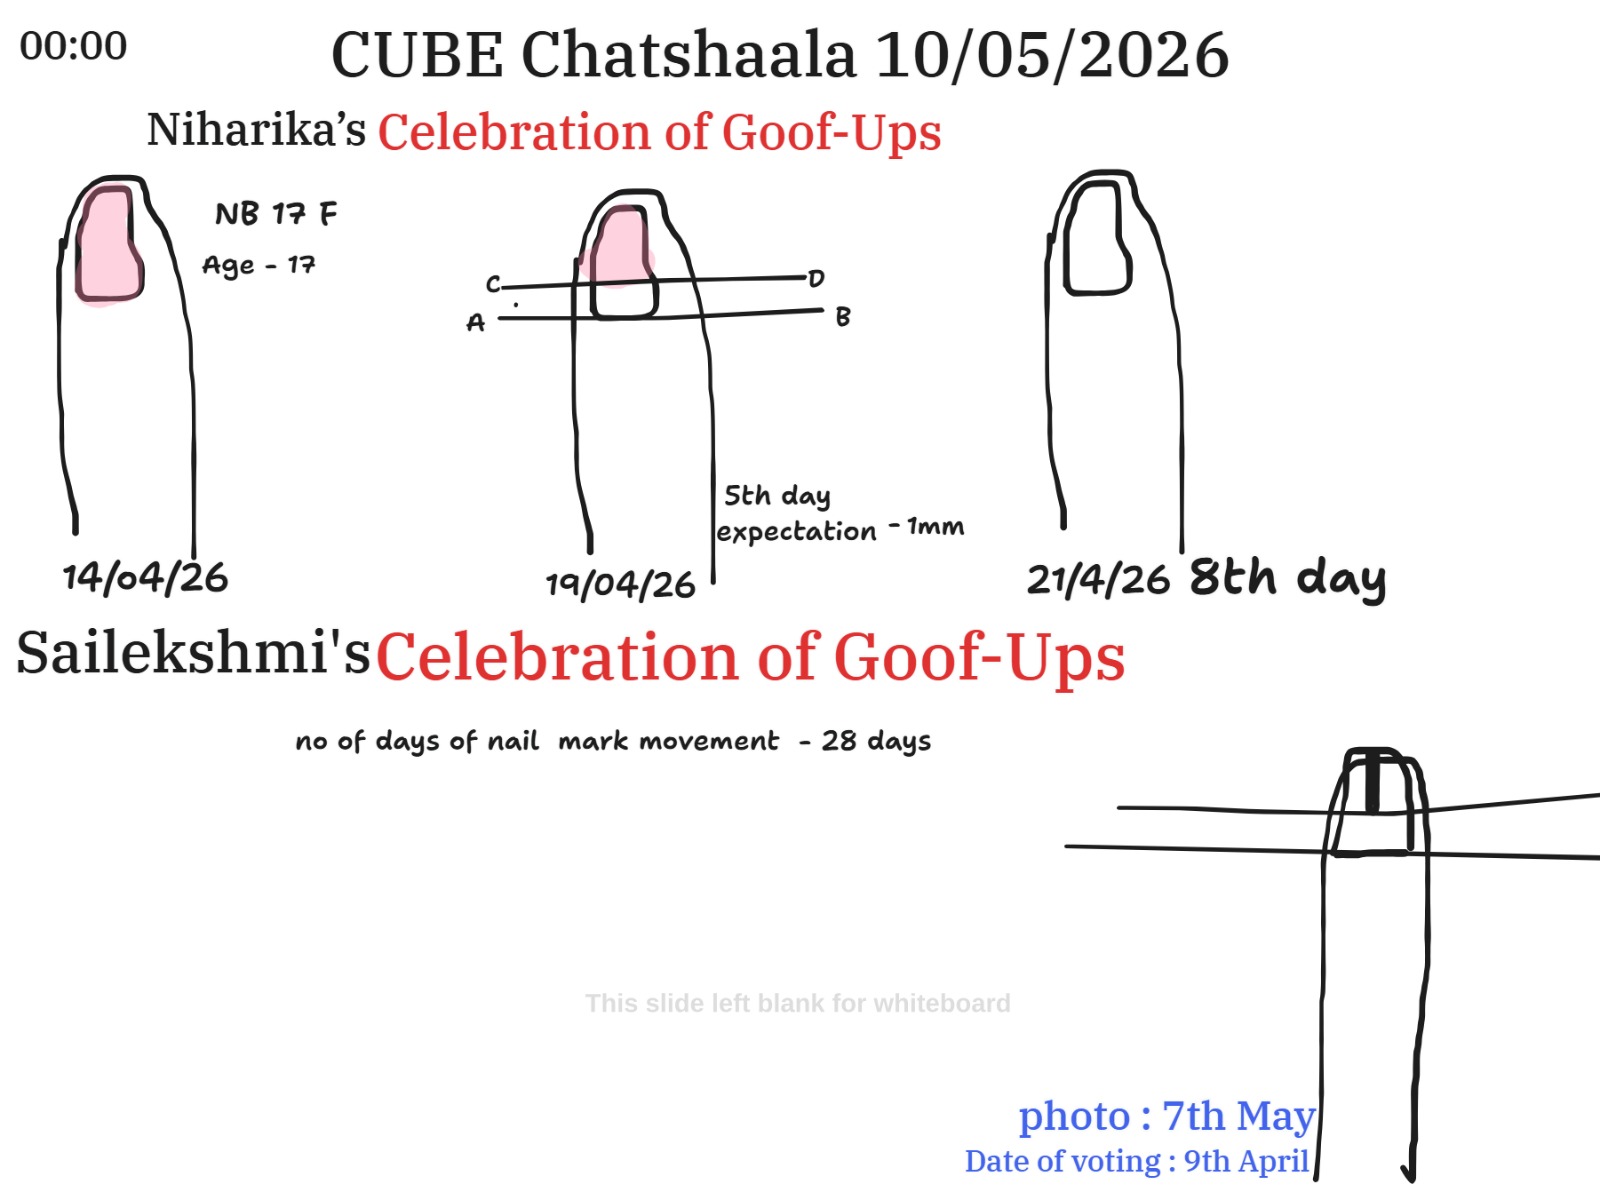
Niharika’s Experiment — Tracking Nail Growth Over Days
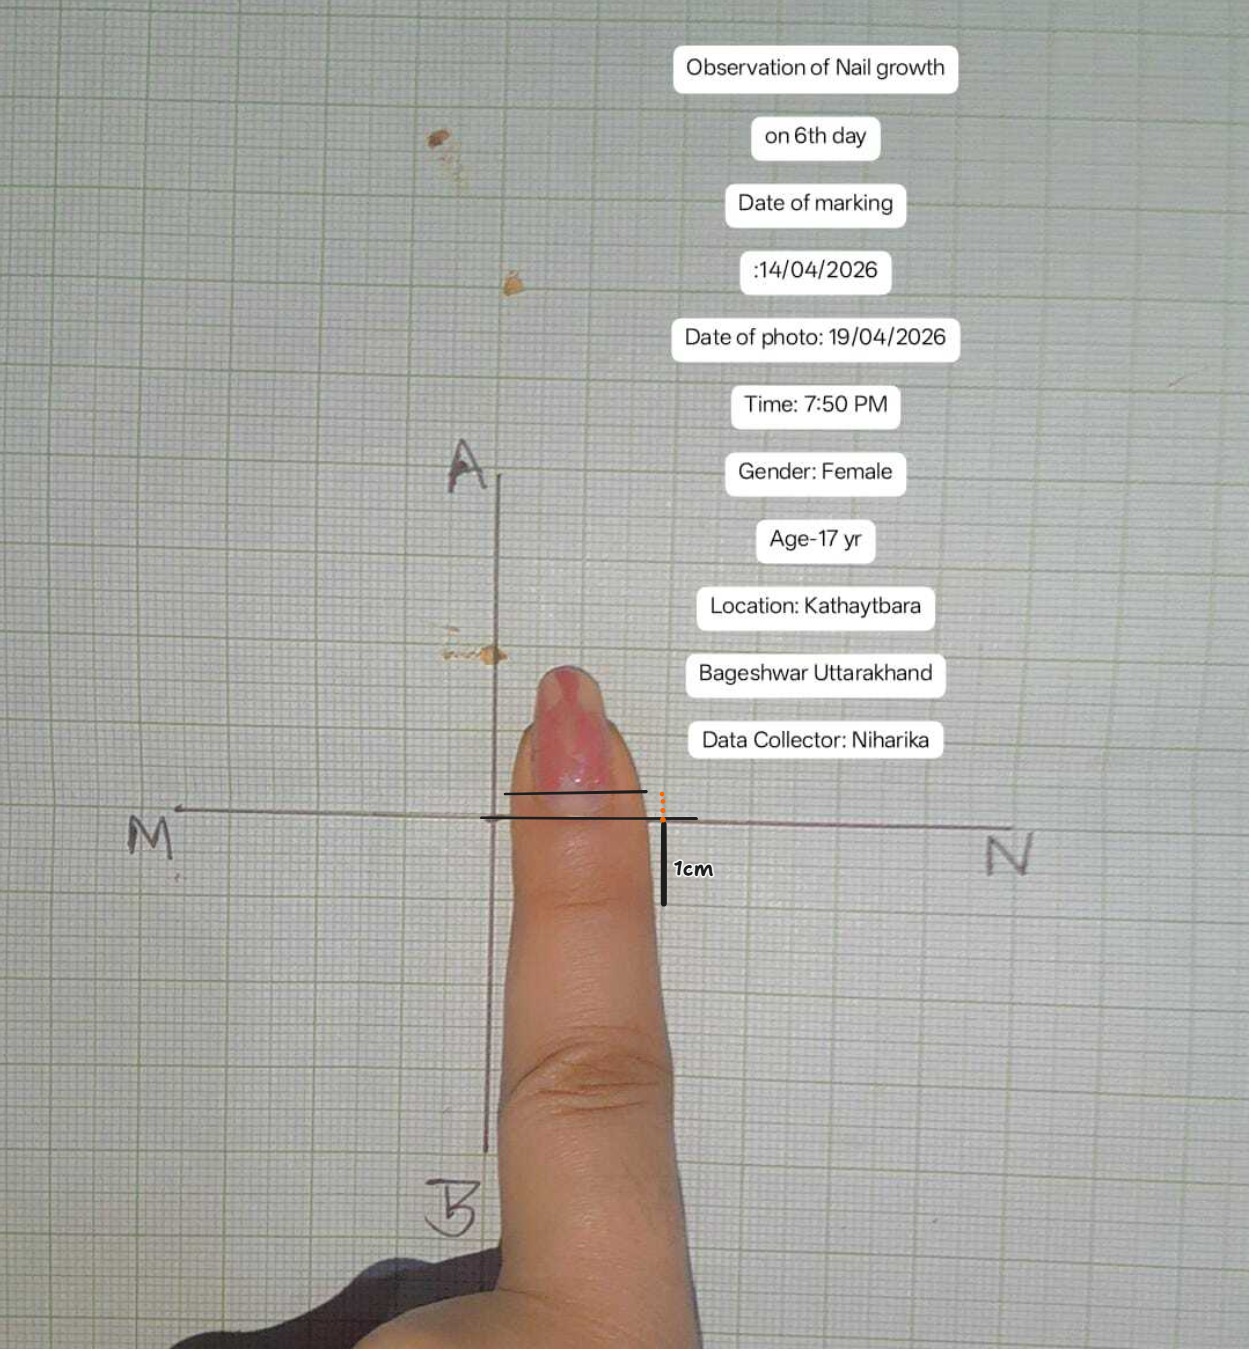
Niharika, a 17-year-old female student based in Kathaytbara, Bageshwar, Uttarakhand, began her nail-marking experiment on 14 April 2026. She used a coordinate axis drawn on graph paper as her reference system, positioning her thumb against the grid and marking the nail carefully.
Her photo record showed three key time points:
- 14/04/2026 — Day of initial marking (the nail had a clearly visible pinkish lunula region)
- 19/04/2026 — Day 5 of observation, where she had drawn reference lines (labelled A-B and M-N) across the nail to track movement; her expectation at this point was approximately ~1 mm of growth
- 21/04/2026 — Day 8, by which time visible displacement of the mark was recorded
The second photograph (Image 2) showed Niharika’s nail on the 6th day (19 April 2026) pressed against the graph paper axis (labelled M-N horizontally, A vertically), with a 1 cm reference scale visible in the image. This is a sound methodological choice — placing the nail against a fixed grid gives a visual reference for calculating displacement without requiring a physical ruler each time.
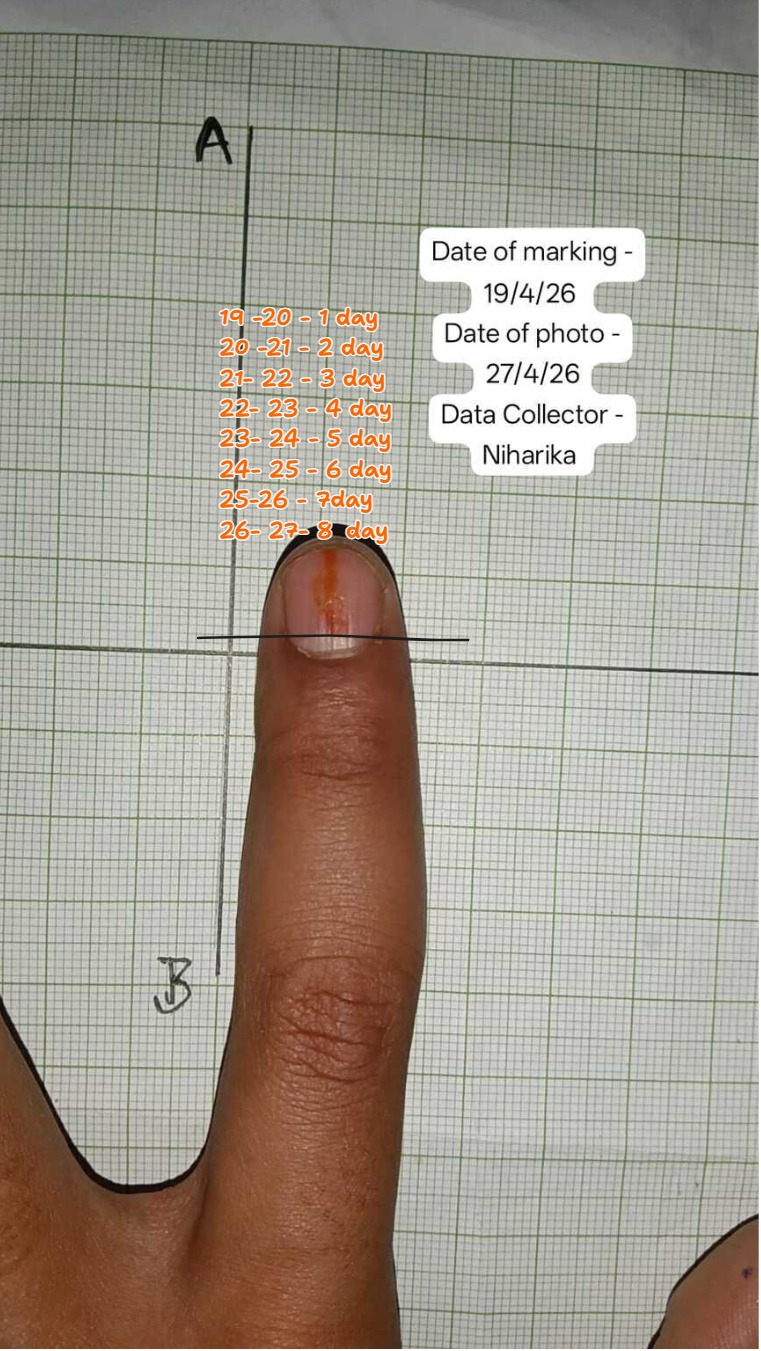
The third photograph (Image 3) documented her second marking session, begun on 19 April 2026, and photographed on 27 April 2026 (Day 8 of the second cycle). Here, the nail clearly showed an orange-coloured streak — likely the marker she used — visibly displaced from the original reference line. The day-count was annotated carefully: Day 1 through Day 8, running from 19–20 April through 26–27 April.
During the discussion, the group noted that Niharika’s original expectation of 1 mm on Day 5 was something worth examining closely. Was the expectation based on prior reading, a hypothesis from the group, or intuition? This question led to a broader conversation about what a reasonable daily rate of nail growth might look like and how one should arrive at such an expectation before collecting data.
Sailekshmi’s Experiment — 28 Days of Nail Mark Movement
Sailekshmi’s contribution was particularly striking in its duration. Her dataset captured 28 days of nail mark movement — a much longer timeline than most participants had attempted. The photograph shared (taken on 7 May) corresponded to a marking date of 9 April, making it a genuine month-long observation.
Her diagram showed the nail positioned against cross-referenced axes, and the group discussed how the mark, having traveled such a distance over 28 days, would give a far more statistically reliable estimate of daily growth rate than a shorter observation window.
The group reflected that short-duration experiments (5–8 days) can be prone to measurement errors that inflate or deflate the daily rate significantly. Sailekshmi’s longer experiment, by contrast, averages out daily variability and gives a more trustworthy figure.
However, a key question emerged: had Sailekshmi recorded measurements at intermediate time points, or only at the beginning and end? If the mark was only photographed on Day 1 and Day 28, the data gives an average rate but does not reveal whether growth was consistent throughout, or whether it slowed, accelerated, or varied in unexpected ways across the month.
Group Discussion — What Counts as Good Data?
The “Celebration of Goof-Ups” framing gave participants the comfort to speak honestly about what went wrong or what they were uncertain about. Some important threads that came up:
On methodology: Placing the nail against graph paper is a clever low-cost approach, but the discussion acknowledged that consistent alignment is tricky. If the finger is pressed at even a slightly different angle each time, the apparent position of the nail mark shifts — not because of real growth, but because of measurement error. This is a real and underappreciated challenge in the experiment design.
On reference lines: Niharika’s use of two reference lines (A-B and M-N) in the Day 5 photograph suggests she was trying to create a coordinate system — measuring both horizontal and vertical displacement of the mark. This is more rigorous than a single-axis approach. The group appreciated this detail.
On expected values: The expectation of ~1 mm on Day 5 implies a rate of about 0.2 mm/day. Published literature suggests fingernail growth is typically around 3–4 mm per month, or roughly 0.1–0.13 mm per day. So 1 mm in 5 days would actually be on the higher end. Whether Niharika’s observed data matched or diverged from this expectation was a central point of discussion.
On the marker: The orange streak visible in Image 3 raises questions about what kind of marker was used, whether it bleeds or spreads over time, and whether the “width” of the mark introduces ambiguity in measuring exact displacement. These are genuine experimental concerns that the group would do well to standardise.
 Provocative Questions
-
Niharika expected approximately 1 mm of nail growth by Day 5. What was the basis of this expectation — prior reading, a group consensus, or personal intuition? How should a student researcher decide what their expected value is before collecting data?
-
Sailekshmi observed 28 days of nail mark movement, but did she record the position of the mark at intermediate points — say, every 7 days? If not, what information is lost by only comparing Day 1 and Day 28?
-
When placing a finger against graph paper for measurement, even a small change in the angle of the finger can shift the apparent position of the nail mark. How can this source of error be minimised or controlled across multiple photographs taken on different days?
-
The orange marker visible on Niharika’s nail in Image 3 — does the width or spread of the marker line itself introduce uncertainty in determining the exact position of the mark? Would a thinner line or a different marking method be more precise?
-
Is nail growth constant throughout the day and night, or does it vary? Could the time of day at which a photograph is taken affect the measurement, and if so, by how much?
-
Do nails grow at different rates on different fingers of the same hand? If Niharika’s experiment used the thumb, and another student used the index finger, are their data directly comparable?
-
Sailekshmi’s 28-day dataset is longer than most. Does a longer observation period necessarily give a better estimate of nail growth rate, or are there circumstances in which it might introduce other complications?
-
How does the CUBE nail-growth experiment relate to what is already known from biomedical literature? At what point does citizen science data need to engage with published findings to become meaningful?
-
What would a proper “negative control” look like in a nail-growth experiment? Is there a way to test whether the mark has truly moved due to growth, as opposed to rubbing off and being reapplied slightly differently?
-
If nail growth is a proxy for cellular activity at the nail matrix, what biological factors — nutrition, sleep, hormonal cycles, illness — might cause the rate to vary from week to week within the same individual?
 What I Have Learned
The first is that errors are not embarrassing; they are informative. The “Celebration of Goof-Ups” is not a gimmick. When Niharika admitted that her Day 5 expectation of 1 mm may not have been carefully derived, that honesty opened up a meaningful discussion about how hypotheses should be grounded. Had she not shared it, that gap in reasoning would have gone unexamined.
The second is that duration matters enormously in biological measurements. Sailekshmi’s 28-day dataset is simply more valuable than a 5-day one, not because the student worked harder, but because biological systems have natural variability, and short windows may catch a fluctuation rather than a trend. This is a principle that applies well beyond nail growth.
The third takeaway is about measurement design. The graph-paper method is elegant in its simplicity, but it is vulnerable to positioning inconsistencies. Science at any scale — whether in a CUBE lab or a professional research institute — faces the same fundamental challenge: making measurements that are reproducible and not contaminated by the method itself. Today’s discussion showed that even young student researchers can identify and articulate these concerns when given the space to think aloud.
Finally, I came away with a renewed appreciation for the value of time-series data. Recording not just the start and end, but intermediate points, is what transforms a measurement into a story. Sailekshmi’s 28-day experiment, if it includes intermediate readings, could tell us something genuinely interesting about whether nail growth is steady, seasonal, or individually variable.
 TINKE Moments (This I Never Knew Earlier)
TINKE Moment 1: The Origin of the Expected Value
When Niharika noted that she expected ~1 mm of growth by Day 5, nobody in the group could immediately say with confidence where that number came from. This is a TINKE moment because it revealed that the expected value — a critical benchmark for the experiment — had not been formally derived. Students often carry assumed numbers without examining their source.
TINKE Moment 2: Angle-Induced Measurement Error
The realisation that pressing a finger at slightly different angles against graph paper can shift the apparent position of the nail mark — independently of any actual growth — came as a genuine surprise to some participants. It exposed a hidden variable that most had not considered when designing their observation protocol.
TINKE Moment 3: The Width of the Marker Line
The orange mark on Niharika’s nail in Image 3 prompted the question: if the mark has a visible width, which edge do you measure from — the leading edge, the trailing edge, or the centre? This is not known until the group decides on a convention, and without that convention, measurements from different students cannot be meaningfully compared.
TINKE Moment 4: Intermediate vs. End-Point Measurements
The discussion around Sailekshmi’s 28-day experiment raised the question of whether she had recorded the nail position at intermediate points. If not, this is a TINKE moment — because it is not immediately obvious to student researchers that an experiment tracking change over time should ideally record that change at multiple time points, not just at the start and finish.
TINKE Moment 5: Comparability Across Individuals and Fingers
It was not fully settled in today’s discussion whether data collected by different students using different fingers is directly comparable. This is a deeper biological question — and a TINKE moment — because the nail growth rate may vary not just between people, but between fingers on the same hand.
 Gaps and Misconceptions
Gap 1 — No standardised protocol for the marking method. Different students appear to be using different markers, different reference axes, and different photography setups. Without a shared protocol, cross-student comparison is unreliable.
Gap 2 — Absence of intermediate measurements in long-duration experiments. Sailekshmi’s 28-day experiment is valuable, but if measurements were only taken at Day 1 and Day 28, the data cannot reveal whether the growth rate varied across the month.
Gap 3 — Expectation not grounded in literature or prior data. Niharika’s Day 5 expectation of ~1 mm appeared to be intuitive rather than derived from published nail-growth rates or from the group’s own previous data. This makes it difficult to determine whether the observed result is surprising, expected, or anomalous.
Misconception 1 — Longer observation automatically means better data. Duration improves reliability only if intermediate data points are recorded. A 28-day experiment with only two measurements (Day 1 and Day 28) is not necessarily more informative than a well-documented 7-day experiment with daily photographs.
Misconception 2 — The nail mark moves only because the nail grows. There is an implicit assumption that any apparent displacement of the mark is due to nail growth. In reality, the mark could partially rub off, smear, or shift due to inconsistent finger placement. Isolating the growth signal from measurement noise is a non-trivial challenge that the group has not yet fully addressed.
Misconception 3 — Data from different individuals is directly comparable without contextual information. Age, sex, nutrition, dominant hand, and the specific finger used all potentially influence nail growth rate. Treating all data points as equivalent without accounting for these variables is a methodological gap the group should work to close.