S1E69 CUBE Chatshaala: Exploring new ways of Learning

Meeting URL:

webinar.hbcse.tifr.res.in

BigBlueButton

A front-end for HBCSE web conferencing server. You can create your own rooms to host sessions, or join others using a short and convenient link.

Please click on the Bigbluebutton above to join the CUBE Chatshaala

Timing:5.30 pm to 9.00 pm
Webinar will be recorded and recording link will be post in the same thread after the webinar.

Looking forward to your participation.
Thanks.

1 Like

CUBE Chatshaala on 23rd August 2020.


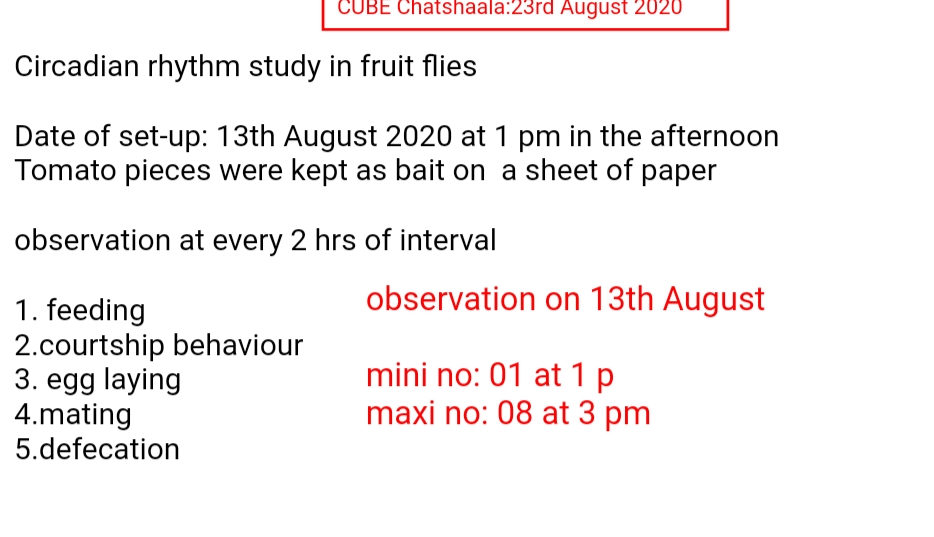
Circadian rhythm studies done by Kshipra, a CUBist from Jharkhand. She summarizes her work done which she started on 13th August at 1pm by keeping some tomato pieces on a sheet of paper and observing & noting down the number of flies she gets at every 2 hour interval.
Activities of fruit flies expected to see by Kshipra during this study were feeding, courtship behaviour, egg laying, mating and defecation.


@drishtantmkawale summarizes:
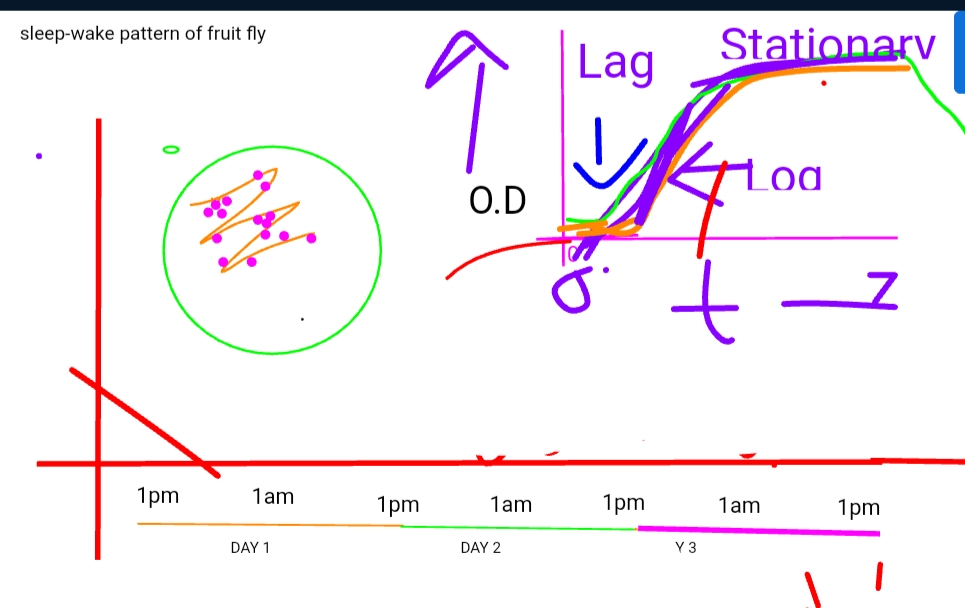
This image from the whiteboard looks like an image having mixed emotions!
All of this started with discussing the sleep-wake pattern of fruit flies and later an attempt was made to plot a graph of the same. But some basic questions like how is a graph plotted, why is there a need for a graph to be plotted? arose which pushed us towards a much-needed diversion from the original topic. The next thing which was discussed was the graph of microbial growth curve. We have a petriplate (with some bacterial colonies in it) which was taken as a reference to depict the different phases of the curve. Many keywords (sometimes, jargons) surfaced, which were broken down/simplified so that we come up with an understandable theory.

35 CUBists from 31 centres joined the webinar.

Breach Candy, South Mumbai: Arunan MC
Ghatkopar, Mumbai: Aashutosh Mule
Mumbai, Maharashtra: Abhijeet Singh
Muvattapuzha, Kerala: Abhijith Vinod
Ghatkopar, Mumbai: Anjani Kashyap
Thane, Maharashtra: Anshu Kadam
Kozhikode, Kerala: Arunima Kunju
Thriprayar, Kerala: Aswathy Suresh
Nerul, Navi Mumbai: Drishtant M Kawale
Mumbai, Maharashtra: Eshita
CDAC Trivandrum, Kerala: Hemant Nandu
Jamia Millia Islamia, New Delhi: Kanishka Parashar
Moradabad, Uttar Pradesh: Kiran Yadav
Bhind, MP: Komal Suman Singh
Patna, Bihar: Kriti
Dumka, Jharkhand: Kshipra
Kandassankadavu, Kerala: Lakshmy PJ
Powai, Mumbai: Lydia Mathew
Ranchi, Jharkhand: Manjuel Jojo
Mulund, Mumbai: Omkar Badnale
DSC, Delhi: P. Chitralekha
Mulund, Mumbai: Priti Kanade
Mysore, Karnataka: Raghu Ram Achar
Morabadi, Ranchi: Rechel Tirkey
Bandra, Mumbai: Saida Sayyed
ANDC, Delhi: Sarita Kumar
Morabadi, Ranchi: Shalini Lal
Patna, Bihar: Shalu Sinha
Mumbai, Maharashtra: Shama Sayyed
Panvel, Maharashtra: Shraddha Sonavane
Thanniam, Kerala: Sidhy PP
Nellore, Andhra Pradesh: Tejasree Beemakonda
Cochin, Kerala: Vineeth Kumar
KMC, Delhi: Yamal Gupta
Shruthi Suresh

3 Likes

Summary of yesterday’s causerie(23.8.2020)
We started with How to draw a graph for showing pattern of fruit flies
While doing so, we derived on the question,
How to draw a graph in the first place
So we took microbial growth curve as a reference to understand this

:small_blue_diamond:To draw the same, we first need to perform the experiment to obtain values
The microbial cultures are taken in nutrient broth and OD or Optical density is calculated with the help of spectrophotometer
IMG_20200824_100345
:small_blue_diamond:Initially I just casually drew a curve(violet in image) showing the log or the growth phase and the stationary phase
Then Saida drew another curve(green in image) showing lag phase and the death phase
I ammended my curve(orange curve) showing the lag phase as well, as it represents the time during which replication is in process.
But how do we consider death phase in a graph plotted for OD v/s time as the cell debris will still be present giving us a reading!
Drishtant, Rechel and others joined in the discussion

3 Likes

But how do we consider death phase in a graph plotted for OD v/s time as the cell debris will still be present giving us a reading!
Drishtant, Rechel and others joined in the discussion

:small_blue_diamond:Rechel asked why to use this method
Can’t we just take colony count and determine these values
So the discussion went to an Alternative method to make microbial curve

Here we streak the petriplate with bacteria
Let’s say we have 15 bacteria as shown by Drishtant in the diagram
These will give rise to 15 colonies
:small_blue_diamond:My argument was that, we can calculate the size of the colony to make the curve
:small_blue_diamond:Whereas Rechel’s argument was that the number of colonies will increase and that should be considered

:small_blue_diamond:Further we discussed, how size in terms of diameter of colony can be used to plot the graph instead of OD
BUT
:small_blue_diamond:I think
We cannot plot lag phase while doing so, as we cannot see the colony on first day, we cannot plot it’s size like we can do in case of OD, we can determine log phase in terms of increase in diameter and stationary phase when we see a mat growth

:small_blue_diamond:Also, this experiment would take days, while the one with OD happens in a matter of few hours

:small_blue_diamond: The question of how to determine the Death phase still prevails, as we can check whether the bacteria is alive or not on taking an inoculum and streaking on fresh plate/in nutrient broth
But how do we determine
Within the initial set up

  • Of OD
  • Of Nutrient Agar plate

Though we can plot when we consider a graph of number of bacteria v/s time
https://images.app.goo.gl/ErNm7aJ7Q9yeGLZZ9
But not OD v/s time

Suggestions please

3 Likes