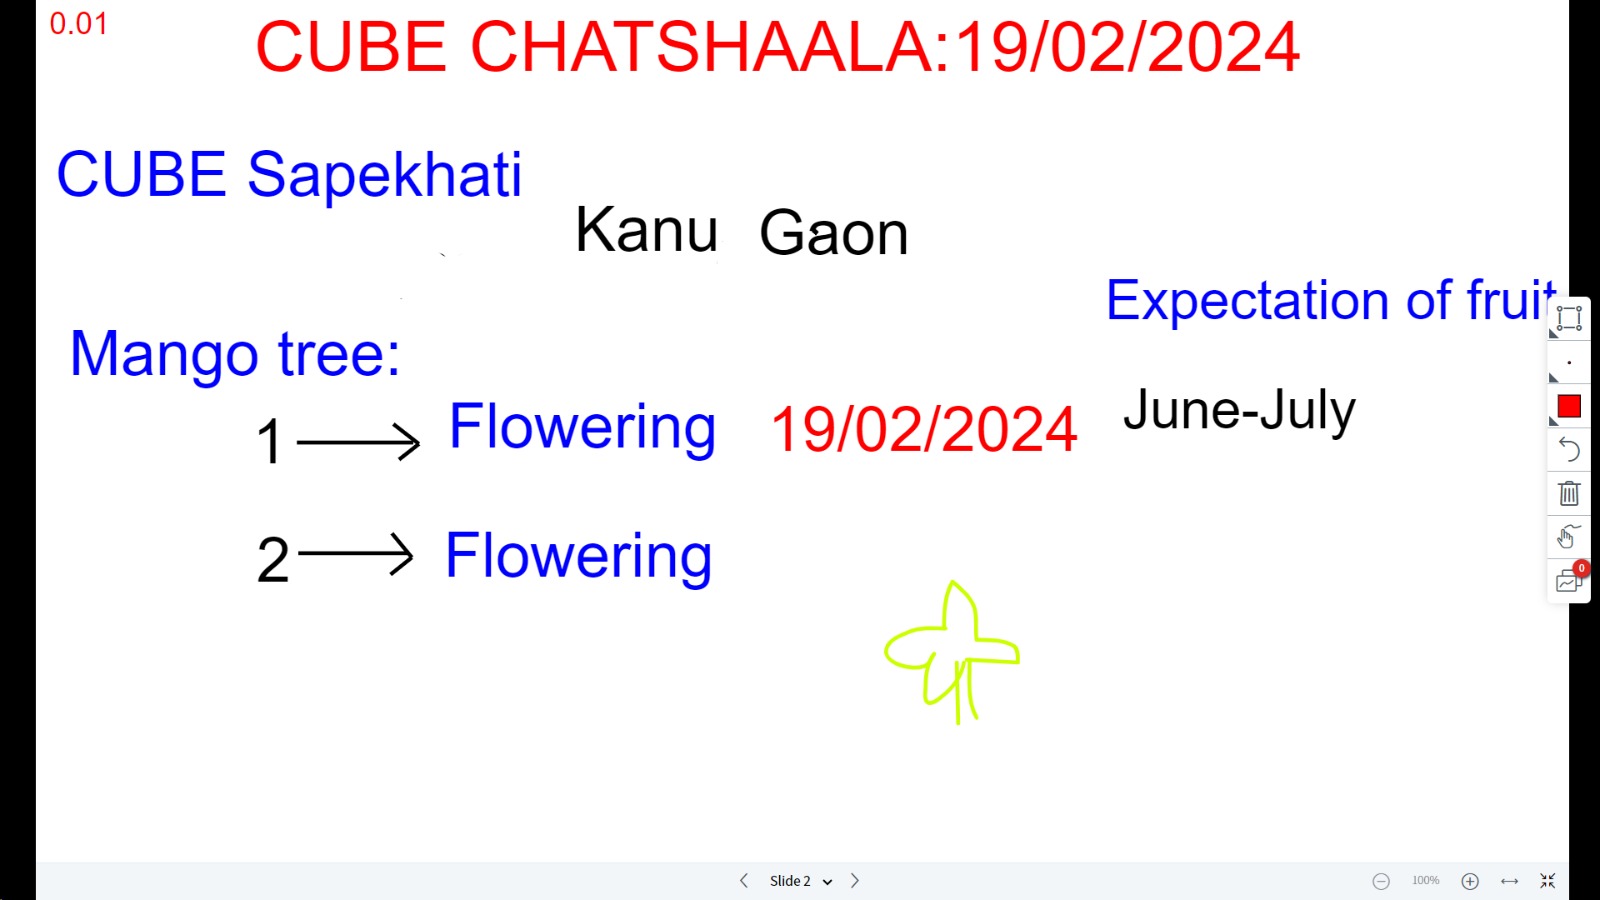
Congratulations to Kashyap @Kashyap Sapekhati and CUBE Sapekhati for collecting mango tree data from Assam.
According to the data collected by Kashyap @Kashyap Sapekhati today, 2 out of 2 were flowering.
When can we expect ripened mango fruit in Sapekhati, Assam?@Susanta Tanti CUBE @Kashyap Sapekhati @~Sweety & others
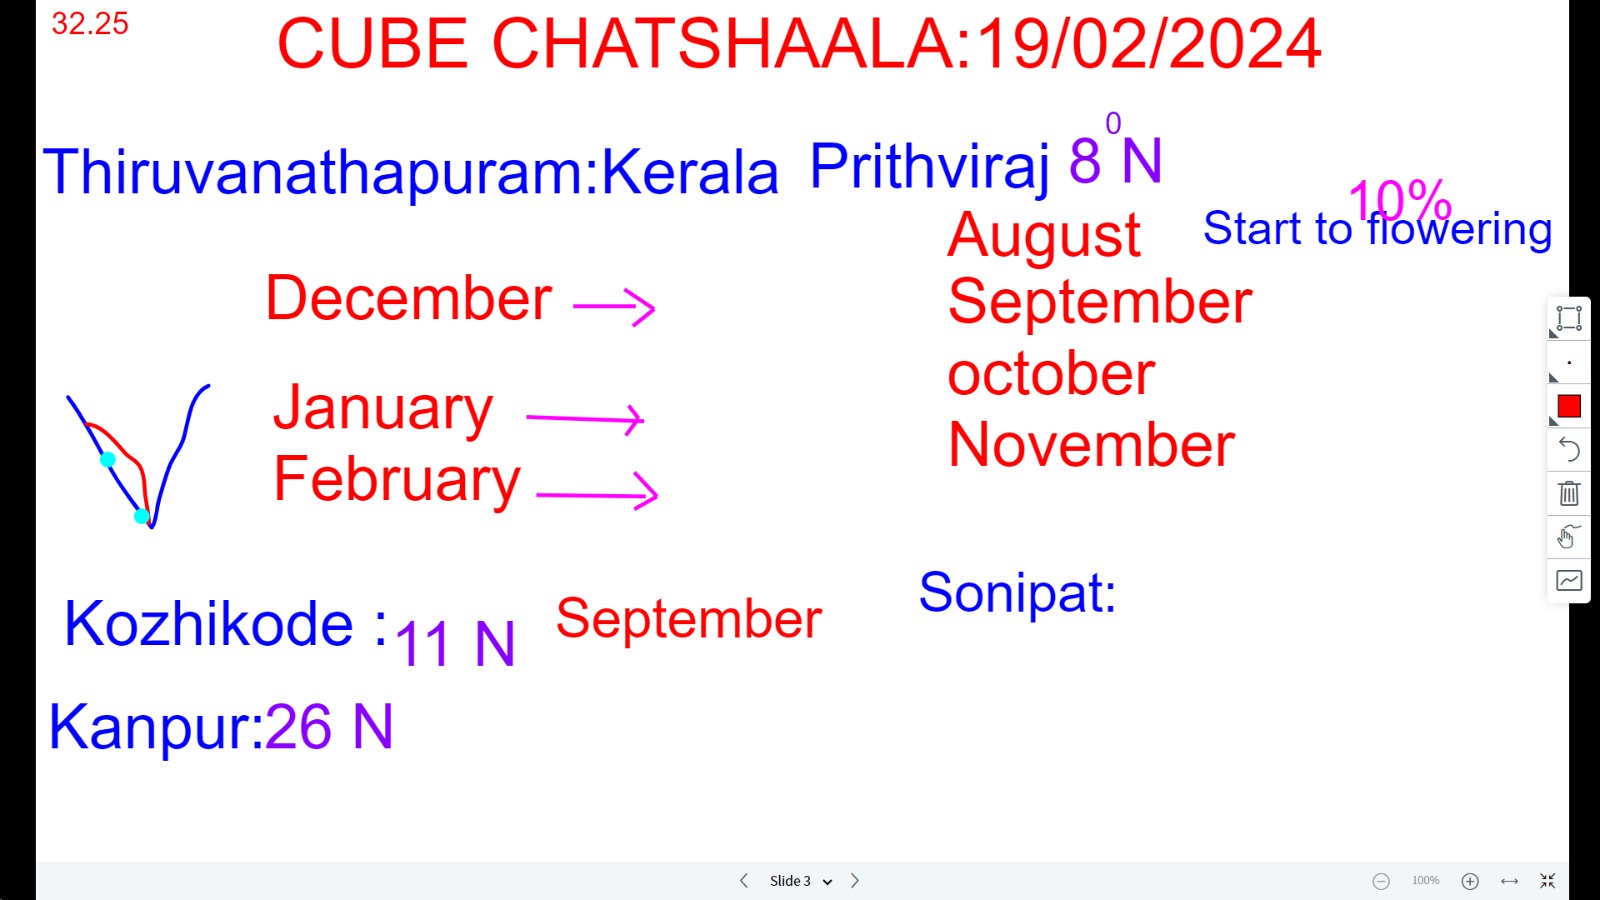
According to the data collected by @Prithviraj CUBE ,kerala mango flowering starts in August.
When are we expecting mango tree flowering in your places?@Rahul CUBE @Sakshi @~Aastha @Hina CUBE & others.
Indeed, the discussion was very informative. Thanks to @Rahul CUBE @~Aastha @Kashyap Sapekhati &others .
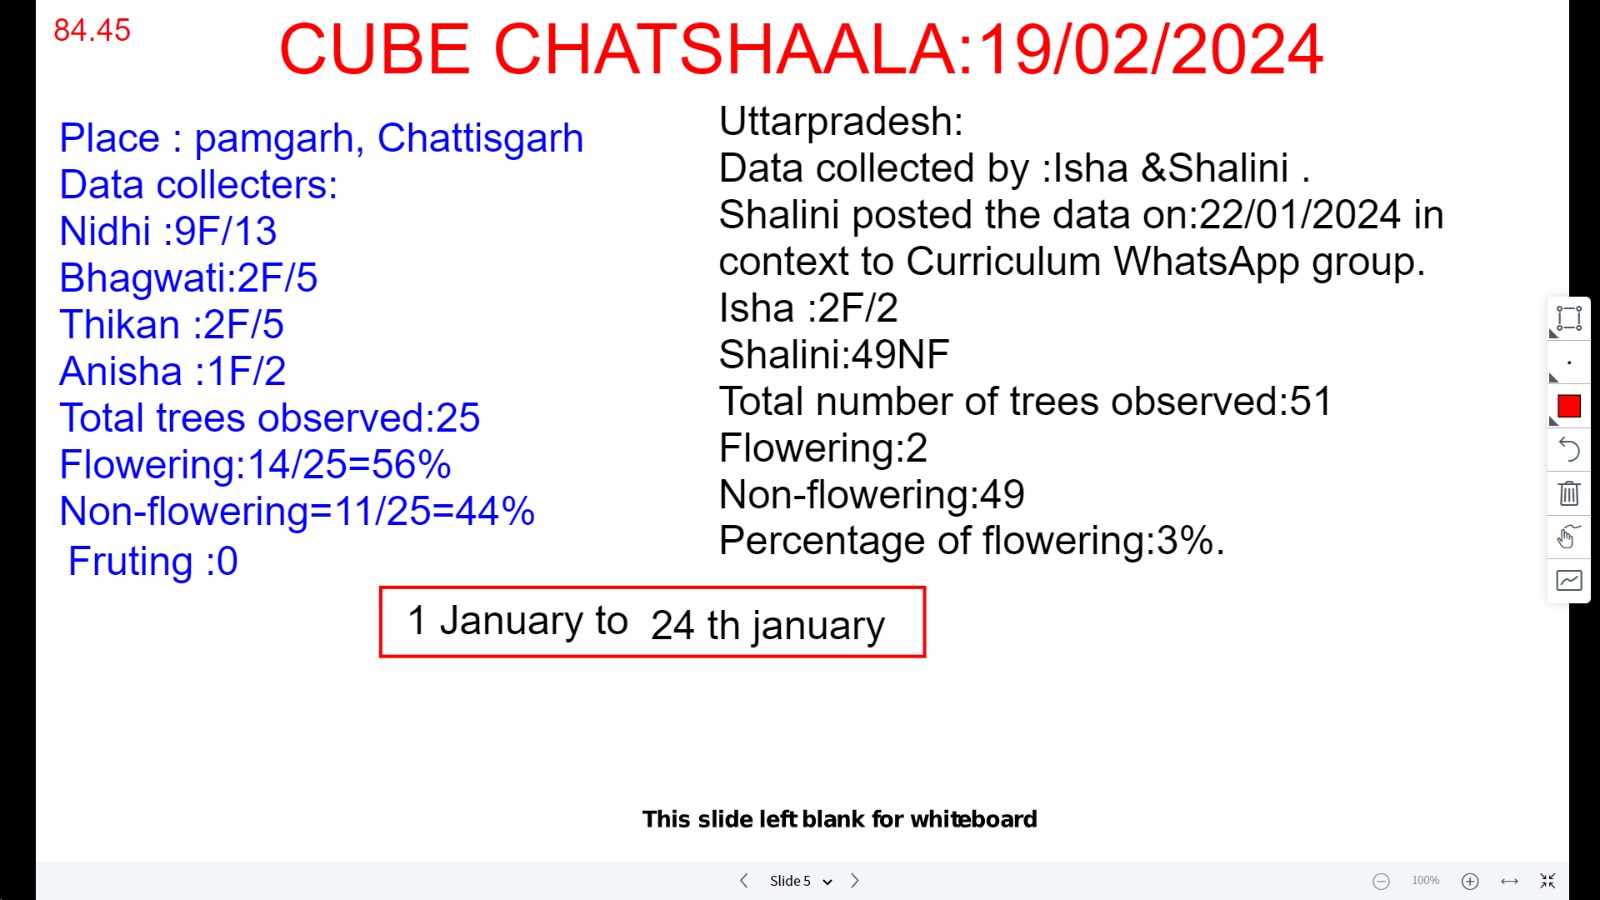
As a part of Republic Day celebration,Cubists collected mango tree data across the country, total of 497 trees surveyed.
Suggestions came in today’s Chatshaala:@Rahul CUBE
1)If we say 60%flowering mango trees flowering and 40%non-flowering from the same place ,
What may be the reason for that ?
A)plant not yet matured !?
B) All mango tree may not flower every year
Can we observe mango tree that is there in your immediate surroundings for a long time to see what’s happening!?
Celebration of Goofups:
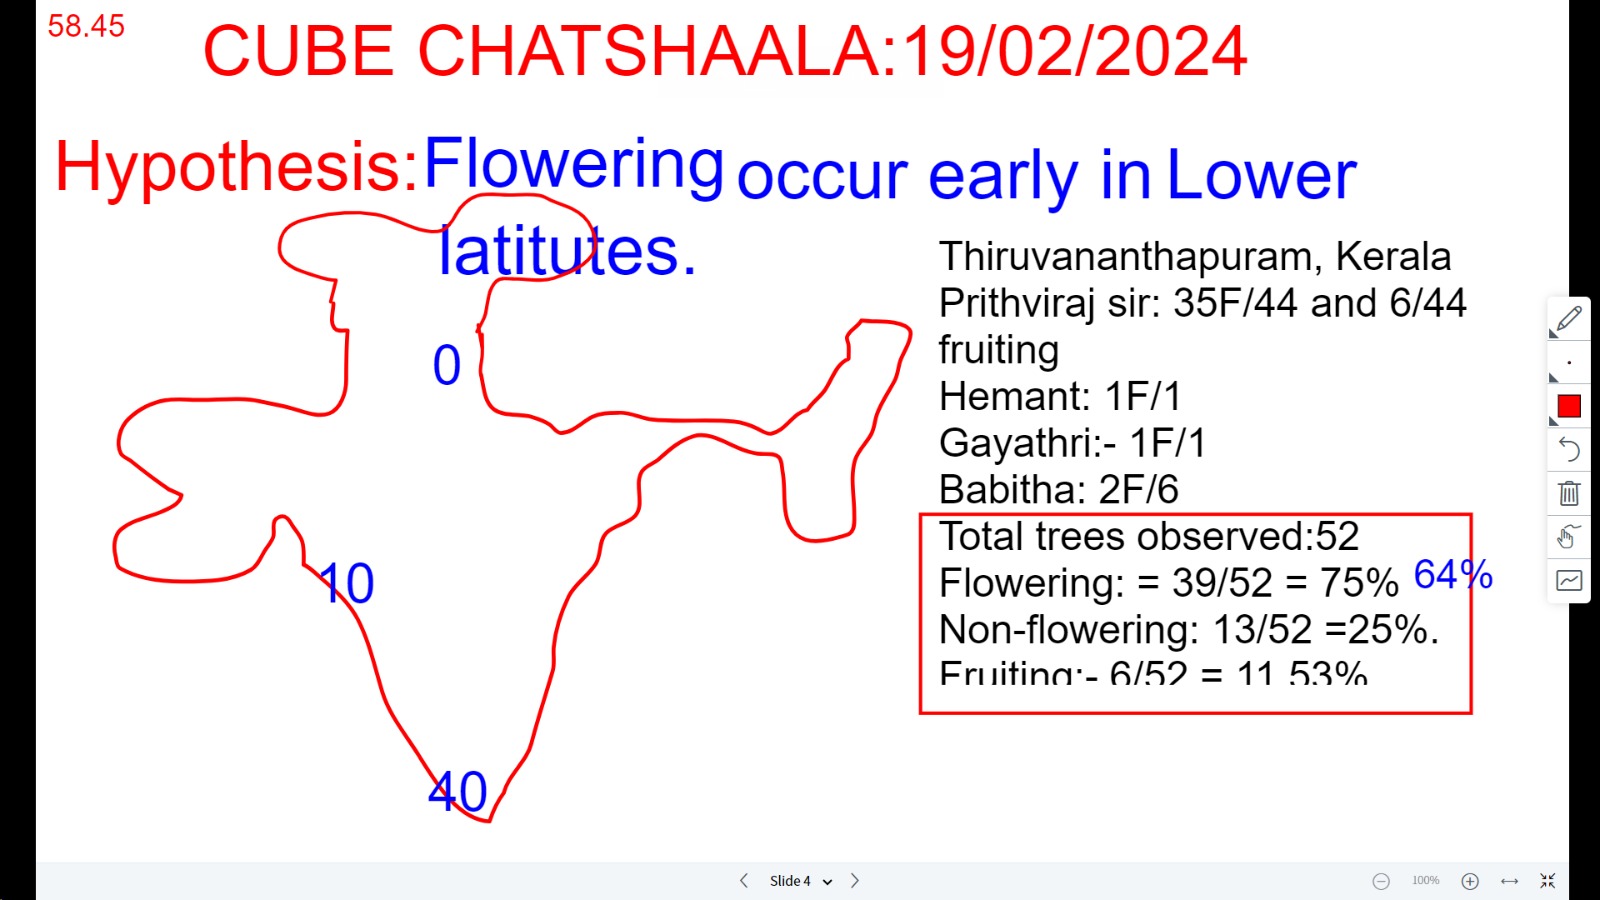
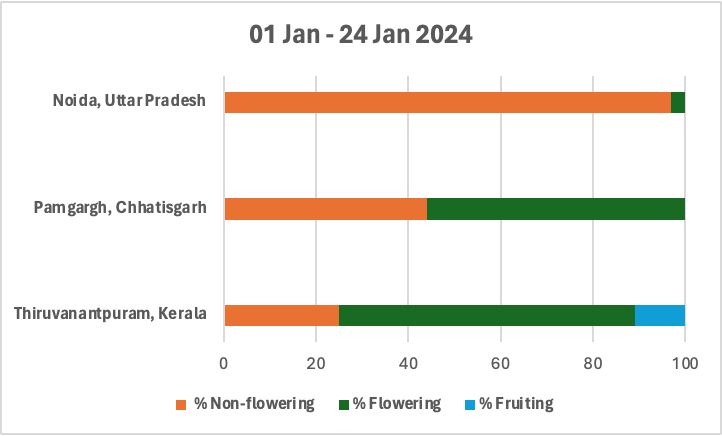
Data from Thiruvananthapuram:
Total trees observed:52
Flowering: = 39/52 = 75%
Non-flowering: 13/52 =25%.
Fruiting:- 6/52 = 11.53%
Percentage in 111!?
Through discussion we corrected that by replacing fruiting from flowering percentage.
Now :
Flowering: = 39/52 = 64%
Non-flowering: 13/52 =25%.
Fruiting:- 6/52 = 11.53%.
Analysis of mango flowering across the country. @Rahul CUBE @Arunan sir @Prithviraj CUBE @Kashyap Sapekhati @Enas CUBE & others
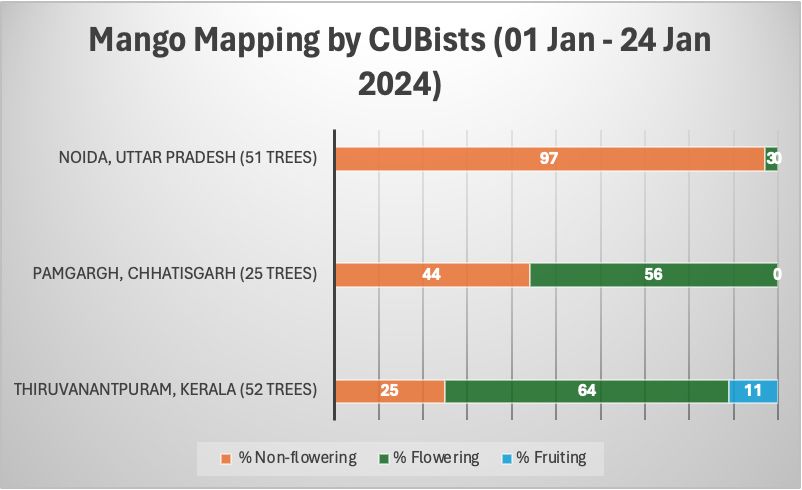
Can we summarize our Republic Day Mango Map briefly!?
The collaborative research showed the beauty of teamwork.
While interpreting the mango tree data, @Rahul CUBE ,simultaneously created a graph ![]() depicting the results.
depicting the results.
Thanks to @Rahul CUBE
The hypothesis was that mango flowering begins earlier in lower latitudes (e.g., Thiruvananthapuram, Kerala) compared to higher latitudes (Noida, Uttar Pradesh).
Can anyone summaries the bar diagram!?
@~Khushi @~Madeeha Abrar @~Aastha @Sakshi @Batul Ma’am @Kashyap Sapekhati @Enas CUBE @Shraddha & others.
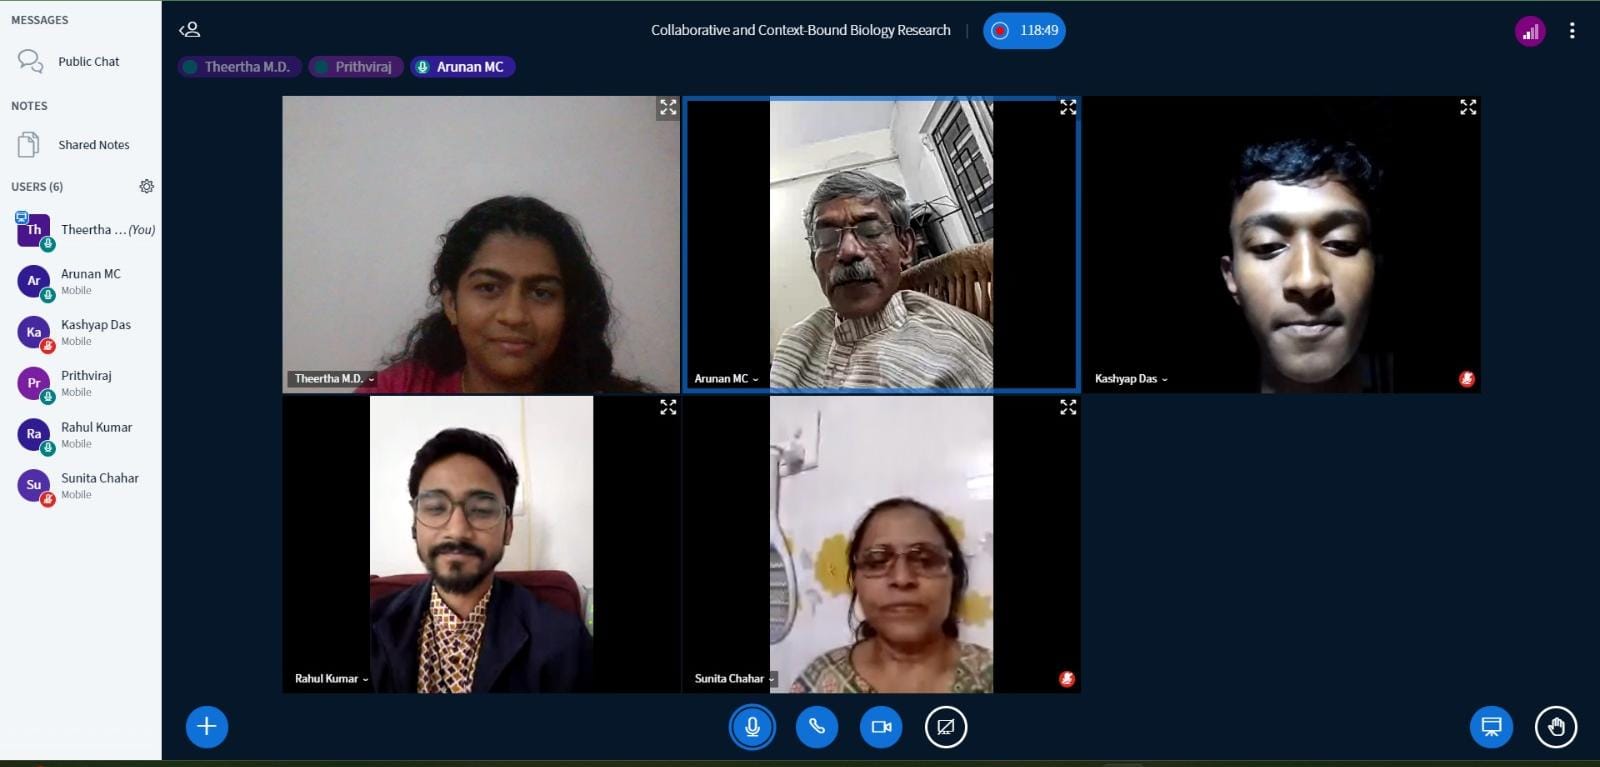
Group photographs of Chatshaala:19/02/2024