CUBE Chatshaala Discussion Summary
Date: January 20, 2026
Subject: Latitudinal Analysis of Mango Phenology and Community Observation Data
Today’s session focused on the collaborative tracking of mango flowering patterns across diverse geographical locations in India. By correlating specific latitudes with the percentage of flowering observed, cubists aim to understand the environmental triggers influencing reproductive cycles in plants.
The core of the discussion revolved around quantitative data collection (sample sizes) and the mathematical verification of flowering percentages (e.g., the 50% flowering rate observed in Pamgarh).
Whiteboard Data Highlights
-
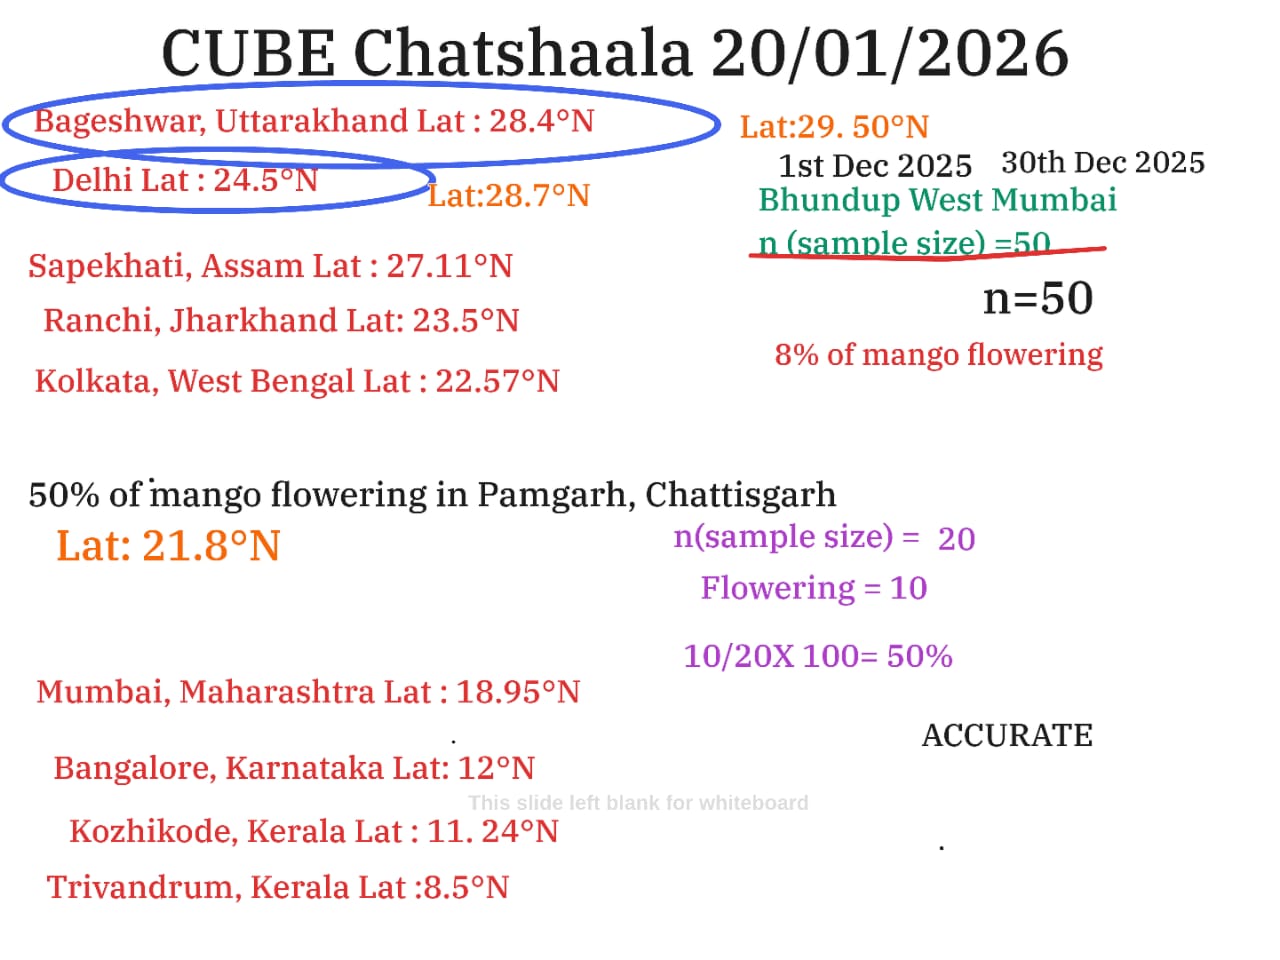
Latitudinal Gradient: Data points ranged from Trivandrum, Kerala (8.5°N) to Bageshwar, Uttarakhand (29.50°N).
-
Case Study (Pamgarh, Chhattisgarh): With a sample size of n=20, 10 trees were found to be flowering, resulting in a calculated 50% flowering rate at 21.8°N latitude.
-
Case Study (Bhandup West, Mumbai): Observations from December 2025 indicated an 8% flowering rate within a sample size of n=50.
 Provocative Queries for the CUBE Community
We see mangoes flowering at 8.5°N and 29.5°N, but the timing is far from synchronized. Is latitude a strict law of nature, or are local micro-climates staging a rebellion against the map?
In Bhandup, we see 8% flowering with 50 samples. In Pamgarh, it’s 50% with only 20. Does a smaller sample size give us a clearer picture, or are we just seeing what we want to see? How many trees does it take to claim a “scientific truth”?
Why were trees in Mumbai showing signs of life as early as December 1st? Are our urban heat islands tricking the trees into thinking spring has arrived months in advance?
The TINKE Moments (This I Never Knew Earlier)
-
A significant moment occurred when the latitude for Bageshwar was corrected from 28.4°N to 29.50°N and Delhi from 24.5°N to 28.7°N. This highlights the importance of spatial accuracy in citizen science.
-
The whiteboard explicitly showed the calculation (10/20 X 100 = 50%), reinforcing that CUBE is not just about observing, but about quantifying observations into verifiable data.
-
The inclusion of specific dates (Dec 1st to Dec 30th) shows a shift from “snapshots” of data to “timelines” of biological change.
 Gaps and Misconceptions
-
The Latitude Gap: There was a noticeable confusion regarding the exact coordinates of northern cities (Delhi and Bageshwar). Miscalculating latitude by even a small amount can lead to entirely wrong conclusions about photoperiodism.
-
Sample Size Disparity: There is a misconception that a lower “n” (sample size) is sufficient to represent an entire region. Comparing n=20 in Pamgarh to n=50 in Mumbai makes it difficult to draw a standardized comparison.
-
The “Static” Misconception: By listing latitudes as static numbers, we may overlook altitude. A tree at 29°N in the mountains (Bageshwar) behaves very differently than one at 29°N in the plains.
 What I Have Learned Today
Today’s Chatshaala reinforced that Phenology is the Pulse of the Planet. I learned that scientific truth isn’t just found in textbooks but in the real-time coordination of people across thousands of kilometers. I realized that a single degree of latitude can mean the difference between a dormant bud and a full bloom, but also that human error in data entry is the first hurdle every scientist must jump over.