CUBE ChatShaala – Discussion Summary
Date: 21 September 2026
Institutional Context: HBCSE – Homi Bhabha Centre for Science Education
Contributor Referenced: Lakshmy PJ, S.N. College, Nattika
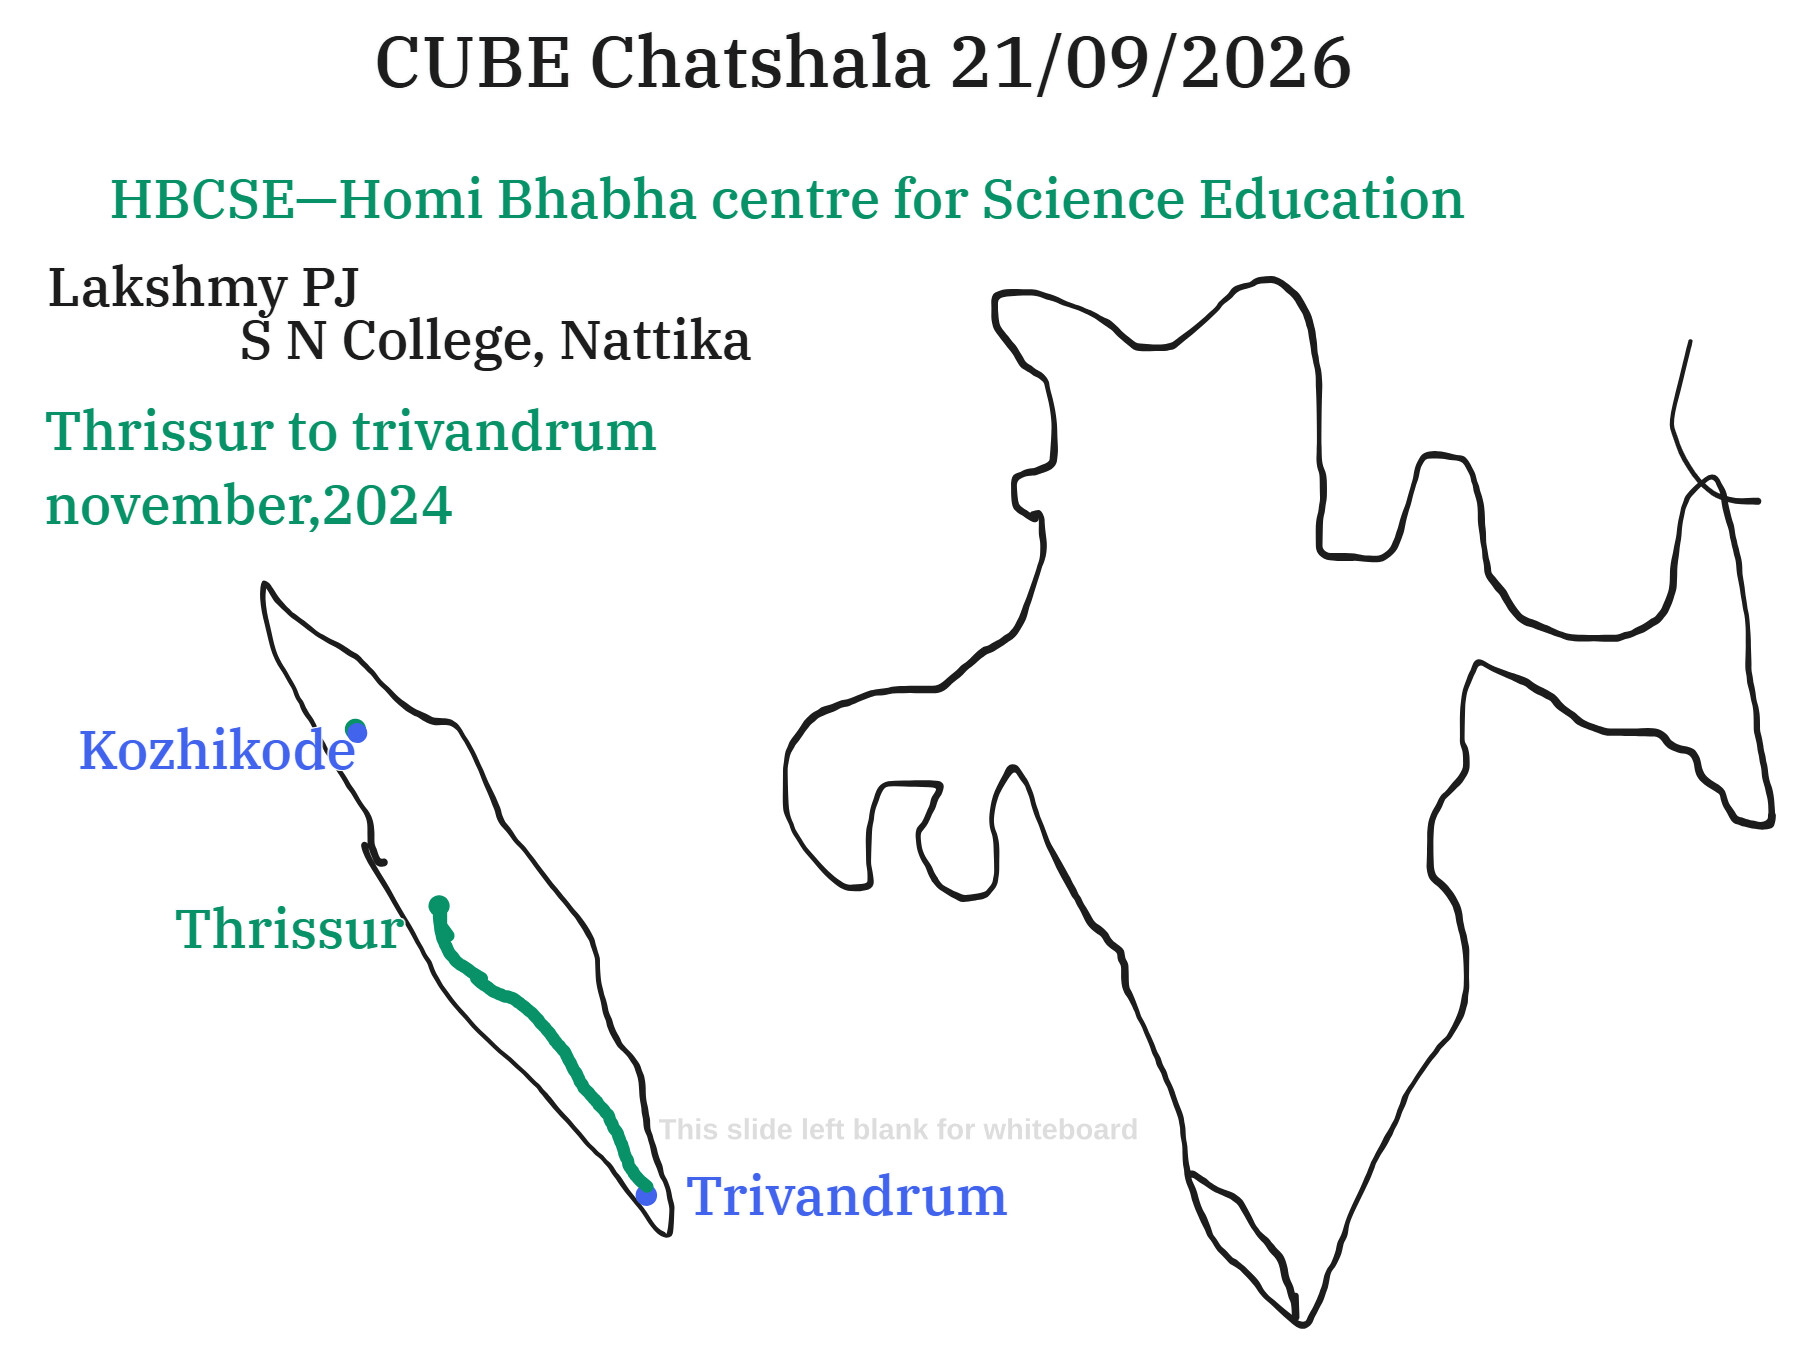
Field Transect: Thrissur → Thiruvananthapuram (November 2024 data)
Summary of the Discussion
Interpreting field-based phenological data of mango trees along a latitudinal transect across Kerala was the main focus of the ChatShaala session. Using spatial representation as a tool for reasoning rather than just illustration, the conversation purposefully shifted from map-making to meaning-making.
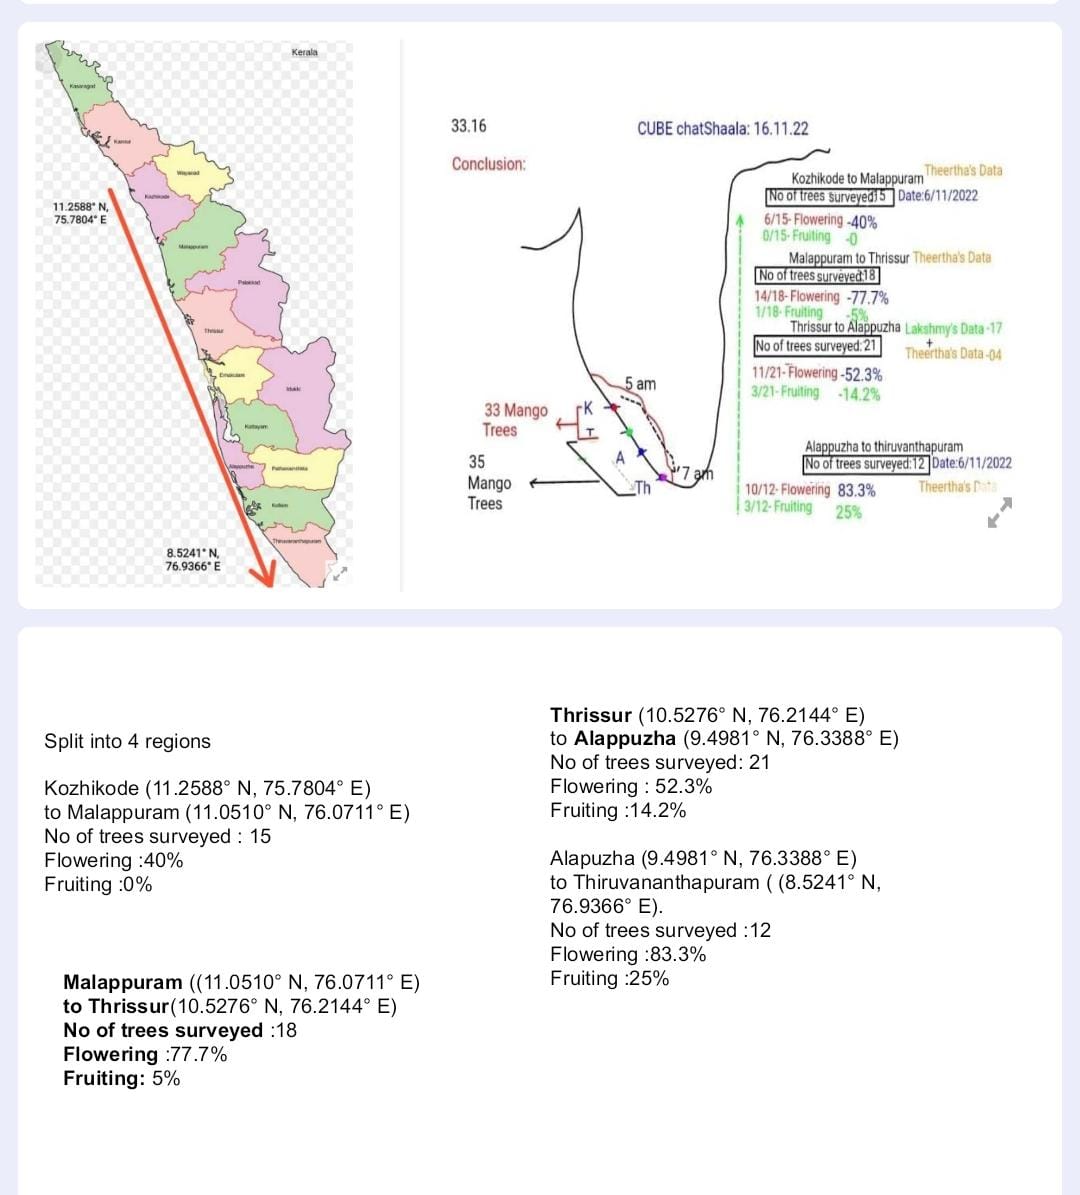
In four regions—Kozhikode–Malappuram, Malappuram–Thrissur, Thrissur–Alappuzha, and Alappuzha–Thiruvananthapuram—participants looked at the differences in mango flowering and fruiting. The whiteboard analysis revealed that while fruiting displayed inconsistent and delayed responses throughout the transect, flowering percentages gradually increased toward the southern regions.
The cubisit questioned why these gradients existed rather than viewing the numbers as discrete statistics. Tree-level variability, sampling time, latitude, and local climate were frequently highlighted. Higher flowering did not always translate into proportionately higher fruiting, which called into question linearity assumptions.
The session’s refusal to oversimplify was one of its main advantages. The cubists recognized that phenology is a combination of climate, geography, timing of observations, and human classification rather than just a biological result. The hand-drawn transect and the Kerala outline functioned as cognitive anchors, assisting cubists in making the connection between lived geography and abstract percentages.
Small sample sizes, uneven regional representation, and observational constraints were openly discussed rather than concealed as the session came to a close with a focus on data humility.
 Whiteboard-Inspired Public Questions
-
If flowering increases southward but fruiting doesn’t follow the same pattern, what exactly are we measuring—trees, seasons, or our expectations?
-
At what point does reporting flowering percentages without ecological context become misleading rather than informative?
-
Are we over-crediting latitude while underestimating microclimate, soil, and human intervention?
-
Could delayed fruiting be an artifact of observation timing rather than plant behavior?
-
When does a sample become representative, and who gets to decide that?
 What I Learned
-
Maps are not passive visuals; they actively shape how we interpret data.
-
Phenological patterns cannot be inferred from single variables like latitude alone.
-
Flowering and fruiting are related but not synonymous biological events.
-
Small datasets demand cautious language, not confident conclusions.
-
Scientific discussion improves when uncertainty is explicitly acknowledged rather than ignored.
 TINKE Moments (This I Never Knew Earlier)
-
The sharp contrast between high flowering and modest fruiting in southern regions disrupted the assumption of direct causality.
-
Realizing that the same species behaves differently across short geographic distances challenged textbook generalizations.
-
The hand-drawn transect made it evident how spatial thinking clarifies biological patterns better than tables alone.
-
Questioning when data is collected emerged as equally important as where it is collected.
 Gaps and Misconceptions
1. Misconception: More flowers automatically mean more fruits
Why it’s wrong: Fruit set depends on multiple post-flowering factors.
Correction: Treat flowering as a prerequisite, not a predictor.
2. Gap: Overreliance on latitude as an explanatory variable
Why it’s limiting: Latitude masks microclimatic and ecological diversity.
Improvement: Integrate rainfall, temperature, and local practices into analysis.
3. Misconception: Percentages imply precision
Why it’s misleading: Percentages from small samples exaggerate certainty.
Correction: Always pair percentages with sample size and context.
4. Gap: Limited temporal coverage
Why it matters: Phenology is time-sensitive.
Improvement: Repeat observations across seasons before drawing trends.
 Closing Note
This ChatShaala did not aim to “prove” a pattern. It succeeded in something more valuable: teaching participants how to think responsibly with imperfect data. That shift—from answers to inquiry—is its real outcome.