 CUBE ChatShaala — Discussion Summary
Date: 13 April 2026
Today’s CUBE ChatShaala session was centred around one of the most accessible and elegantly designed citizen science projects: using the voter’s ink mark on the finger as a natural, time-stamped reference point to measure and study human nail growth rate. The discussion drew from live photographic data, arithmetic reasoning, historical scientific parallels, and the broader question of what makes a photograph scientifically meaningful.


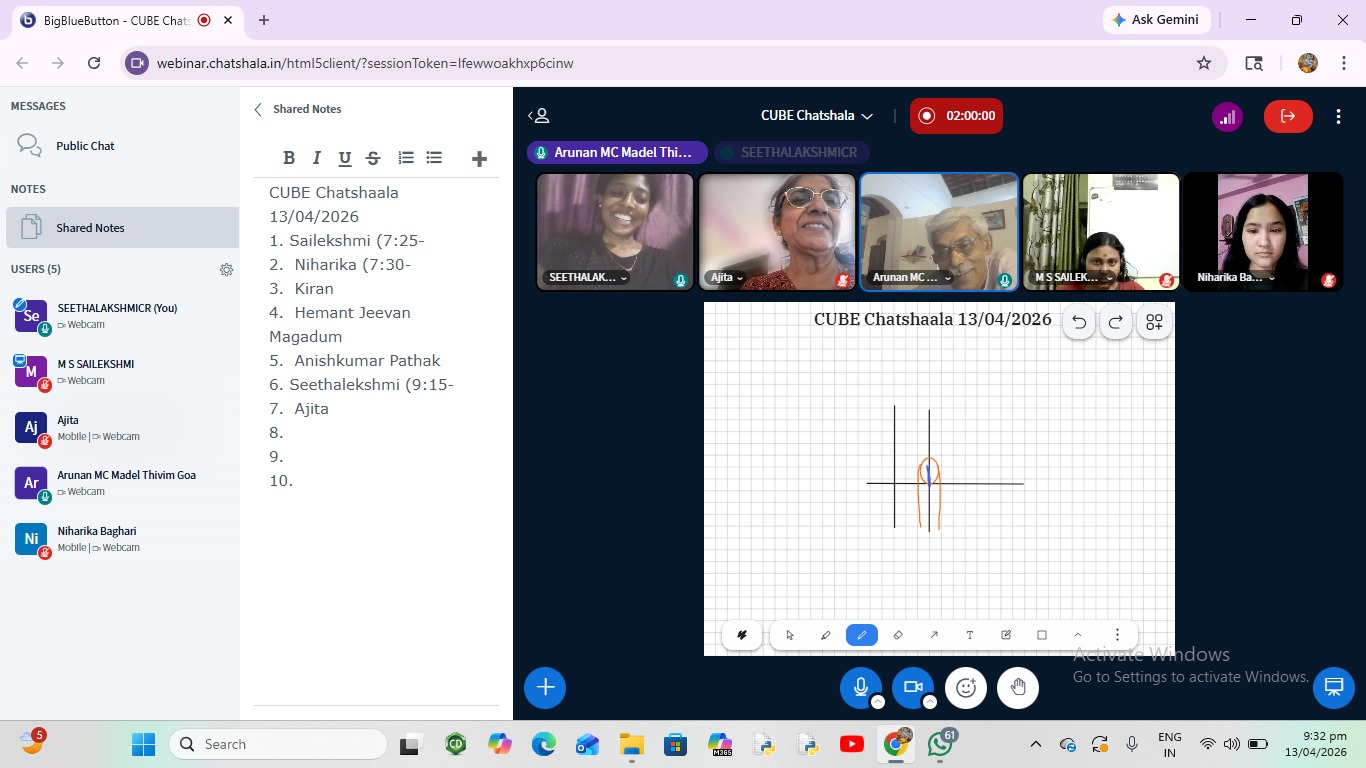
The session opened with a whiteboard sketch — a coordinate axis with what appeared to be a nail-shaped ellipse drawn at its centre — signalling that the group was thinking about nail growth in terms of measurable, plottable data. This framing set the tone for a meeting that would blend biology, mathematics, and research methodology.
The Core Experiment: Voter’s Ink as a Biological Clock
The central idea of the project is beautifully simple. When a person votes, an indelible ink mark is applied to their left index fingertip. Since this mark is placed at the base of the nail at a known date and time, any photograph taken subsequently — with the finger placed against graph paper or a ruler — can reveal precisely how far the nail has grown from that reference point. The ink mark doesn’t move; the nail grows up and away from it. The gap between the mark and the base of the nail is therefore a direct measurement of nail growth.
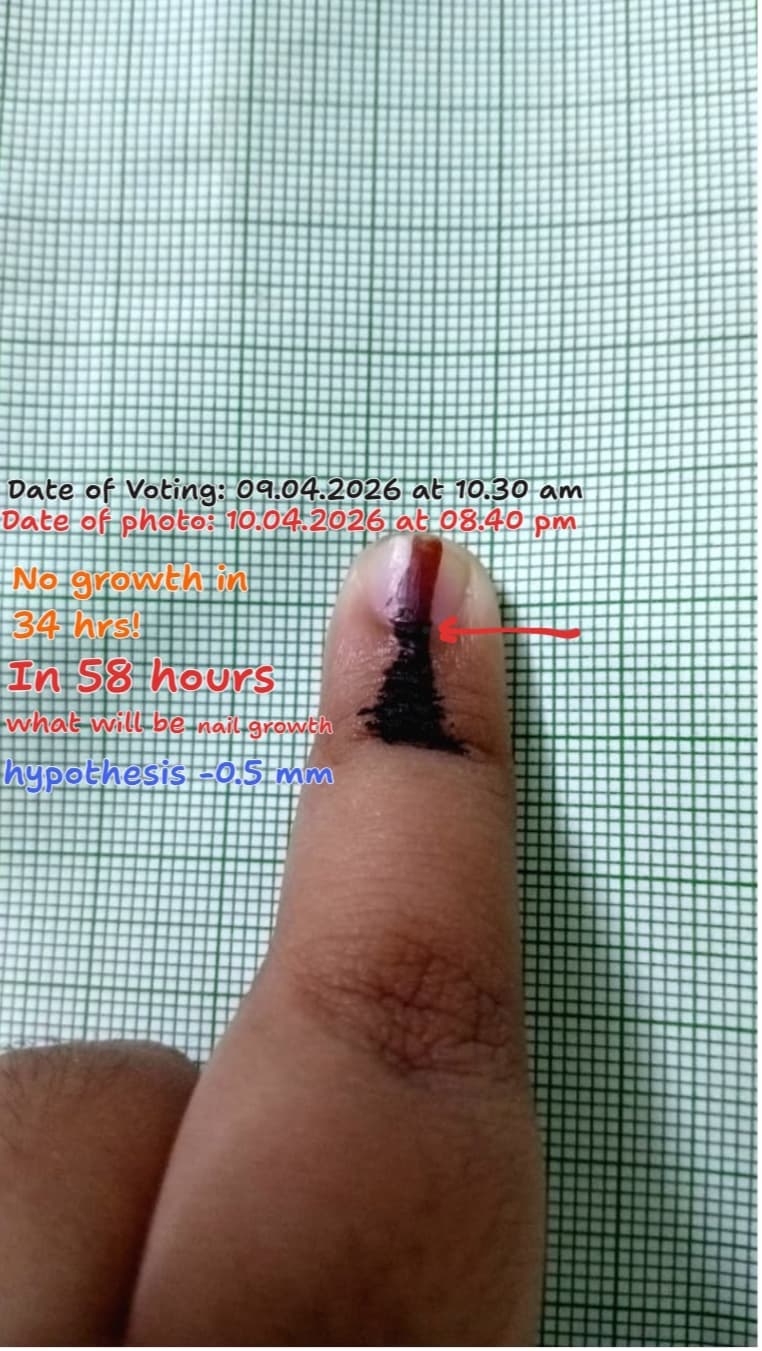
One participant shared a photograph marked “Date of Voting: 09.04.2026 at 10:30 am” and “Date of Photo: 10.04.2026 at 08:40 pm.” The annotation on the image noted: “No growth in 34 hrs!” — followed immediately by a hypothesis: in 58 hours, nail growth would likely be 0.5 mm. This was not a throwaway guess; it emerged from prior data and reasoning.
The Arithmetic of Growth: Turning a Photo into Data
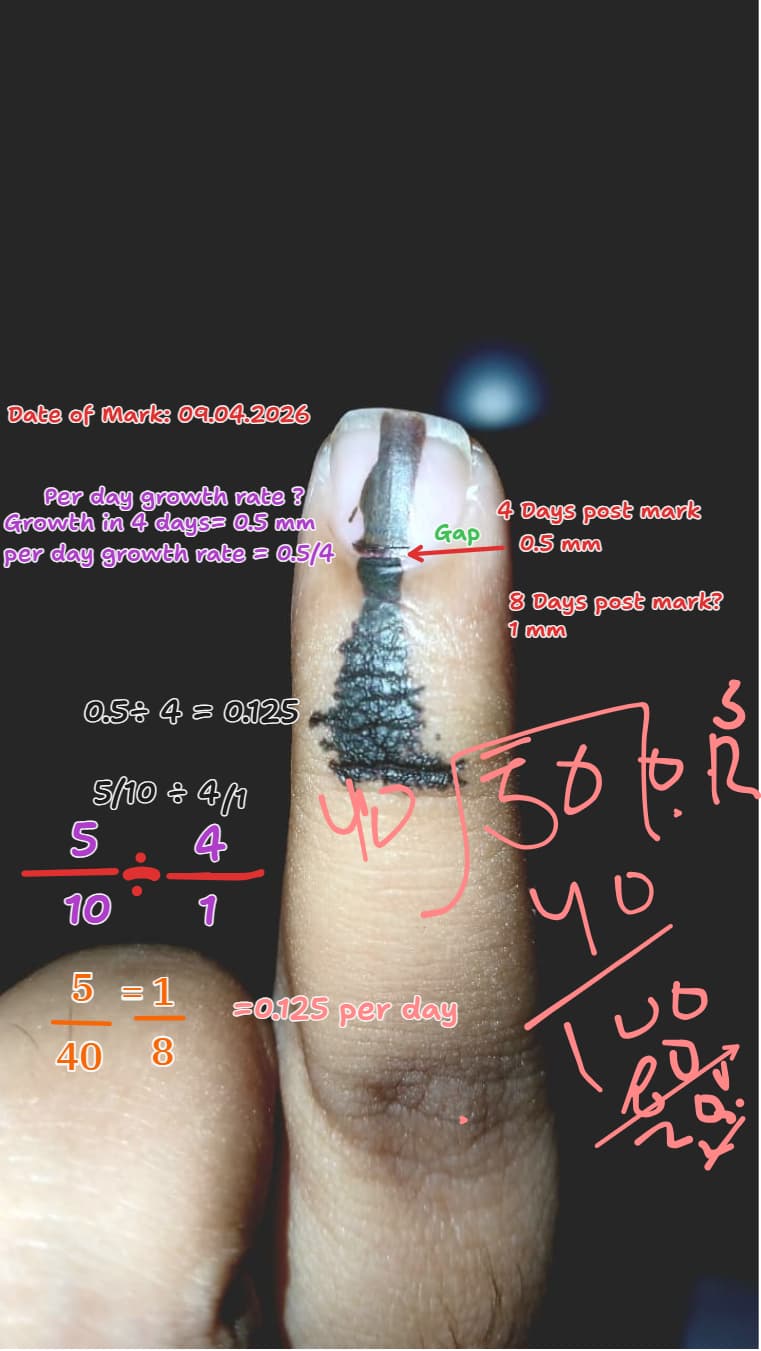
A second photograph, annotated in detail, showed a mark from 09.04.2026. The observed data were:
- Growth in 4 days = 0.5 mm
- Per day growth rate = 0.5 ÷ 4 = 0.125 mm/day
This was worked out explicitly on the image itself, with the fraction written as 5/10 ÷ 4/1 = 5/40 = 1/8 = 0.125 per day. The group was essentially demonstrating how raw photographic evidence becomes quantitative biological data — a key pedagogical point of the session.
An extrapolated prediction was also posed: if growth at 4 days is 0.5 mm, then at 8 days it should be approximately 1 mm — assuming a constant growth rate. This linear assumption itself became a point worth questioning.
How Does a Photo Become Data?
One of the most compelling slides asked directly: “How does the photo become DATA?” The image showed a finger with a visible ink streak — annotated as “indication of a growing nail.” But surrounding this were deliberately provocative references:
- Alexander Fleming’s accidental discovery — a nod to serendipity in science
- Penicillin & Staphylococcus — connecting the streak-like appearance of the ink to Fleming’s famous petri dish observation
- Nematode? — a speculative label pointing to the tapered, worm-like shape of the ink trail on the skin
This was not idle speculation. The session was using these comparisons to push participants to think about how an untrained eye looks at an image versus how a trained scientific eye extracts meaning. The same photo can be dismissed as a smudge or recognised as a data point — the difference lies entirely in the observer’s framework.
Longitudinal Data: The Case of AV27F
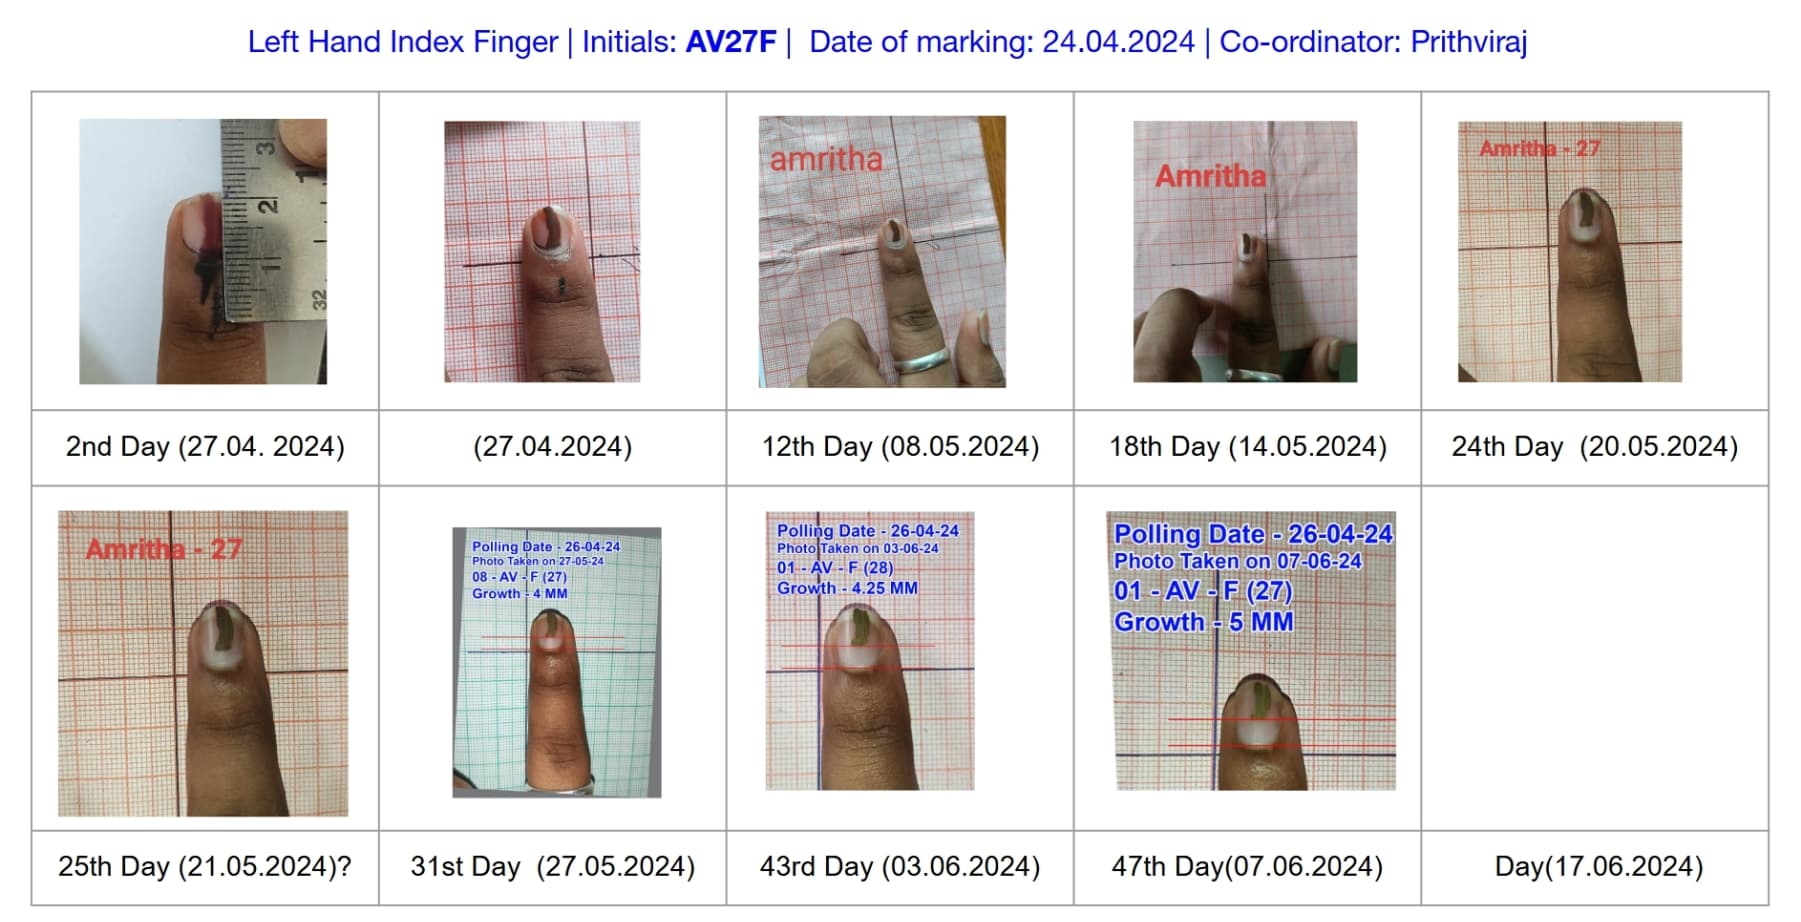
The session also reviewed a structured longitudinal data set from a previous election cycle. Participant AV27F (Amritha), left hand index finger, was marked on 24 April 2024 under the coordination of Prithviraj. A grid of nine photographs tracked her nail from Day 2 through to Day 47 and beyond:
- Day 2 (27.04.2024): Mark applied, baseline set
- Day 12 (08.05.2024): Early growth visible
- Day 18 (14.05.2024): Continued growth
- Day 24–25 (20–21.05.2024): Growth measurable against graph paper lines
- Day 31 (27.05.2024): Growth = 4 mm
- Day 43 (03.06.2024): Growth = 4.25 mm (participant AV-F-28)
- Day 47 (07.06.2024): Growth = 5 mm (participant AV-F-27)
This longitudinal series demonstrated not only that nail growth is measurable with household tools and a mobile phone, but also that growth is not perfectly linear — the difference between Day 31 and Day 43 (only 0.25 mm over 12 days) versus Day 43 to Day 47 (0.75 mm over just 4 days) raised interesting questions about variability and measurement error.
The CUBE Invitation Game Framework
The broader project, documented at metastudio, invites students, teachers, and citizens across India to collect and submit nail growth data using election ink marks. The methodology is deliberately kept simple — place finger on graph paper, photograph it, note the date — so that participation can be massive and distributed. Data is submitted through a form and made publicly accessible for collaborative analysis.
The long-term vision is to understand how physiological variables — age, gender, chronic illness, nutritional status — influence nail growth rate. The nail bed, as one participant noted, is biologically highly active, making it a surprisingly rich site for citizen science inquiry.
 Provocative Questions
-
The group observed “no growth in 34 hours” — but is this truly no growth, or is it simply below the resolution of visual detection? What is the smallest increment of nail growth we can reliably measure with a mobile phone camera and graph paper?
-
If nail growth is assumed to be linear at 0.125 mm/day, what would cause deviations from this linearity? Could illness, diet, sleep, or stress produce measurable differences — and how would we design the study to test this?
-
The ink mark from the voter’s registration is applied on the skin just below the nail, but nail and skin grow at different rates. How do we ensure that the reference point (the edge of the ink on the nail itself) is being measured consistently across participants?
-
Fleming noticed something unusual on a plate most scientists would have discarded. What habits of observation would make a citizen scientist more like Fleming — and how does CUBE cultivate those habits?
-
The longitudinal data from 2024 shows AV27F’s nail grew 5 mm over 47 days, but the rate was uneven. Does this tell us something about biology, or about measurement error — and how do we tell the difference?
-
The whiteboard diagram showed an ellipse on a coordinate axis. What does it mean to represent a nail’s growth on a graph? What should go on the x-axis and y-axis, and what shape would the growth curve take over time?
-
If the ink mark on the fingertip could be used to measure nail growth, could it also potentially serve as a window into broader health indicators? What would you need to prove that claim scientifically?
-
The session raised the question of whether photographs without a reference scale are usable. Should CUBE develop a standard protocol for photographs — and if so, who should define that standard?
-
Could the voter’s ink mark experiment be replicated in non-election contexts — using nail paint, henna, or other household substances — without losing scientific validity? What would change?
-
The image annotation asked: “Is that a nematode?” — a playful but serious question about perception. What does it take to go from seeing a shape to forming a hypothesis? How is that different from jumping to a conclusion?
 What I Have Learned
This session was a genuine reminder that science does not always begin in a laboratory. It can begin at a polling booth, with a smudge of indelible ink on a fingertip.
The most powerful lesson today was about the transformation of observation into data. A photograph of a finger is just a photograph until someone places it against graph paper, notes the date, and measures a gap. That act of contextualisation is what makes it science. The image of the nail with the ink streak wasn’t just biological evidence; it was a lesson in methodology.
I also learned that citizen science requires scaffolding. The CUBE project works because the protocol is simple enough for anyone to follow, yet rigorous enough to generate comparable data across participants. The tension between simplicity and rigour is a design challenge worth taking seriously.
The connection drawn to Alexander Fleming was not decorative. It was a pedagogical move to remind participants that the history of science is full of moments where someone paid attention to something others dismissed. The ink streak on the finger, the unusual gap near the nail base — these are small observations with potentially large explanatory power.
The arithmetic worked through on the annotated photograph — going from a raw measurement of 0.5 mm over 4 days to 1/8 mm per day — showed that mathematics is not separate from biology. It is the language through which biological observations become comparable, sharable, and testable.
Finally, the longitudinal data from AV27F reminded me that science is patient. The value of tracking one finger over 47 days is not just the final measurement of 5 mm — it is the entire trajectory, including the days when growth appeared to stall, the days it surged, and the questions those variations provoke.
 TINKE Moments
TINKE — This I Never Knew Earlier
TINKE 1: Zero growth in 34 hours
The observation that no growth was visible in 34 hours initially seemed like a null result. But it is actually a significant TINKE moment: it highlights that nail growth operates on a timescale longer than a single day, and that our measurement tools need to match the biological scale. The absence of visible growth is not the absence of growth — it is a limitation of resolution.
TINKE 2: The linearity assumption
The calculation of 0.125 mm/day was presented as a rate, implying constant growth. But the longitudinal data from 2024 shows that growth is not perfectly linear. This is a TINKE moment because participants have just acquired a formula — and now must grapple with its limits.
TINKE 3: The reference point problem
Several participants may not have considered that the ink mark is applied to the skin, not the nail. As the nail grows, the mark on the nail surface moves forward — but the mark on the skin remains stationary. Choosing the correct reference point is critical and not immediately obvious. This is a common source of measurement confusion in the project.
TINKE 4: Photo without scale = unusable data?
Some photographs shared in the broader CUBE community had no graph paper or ruler in the background. The group discussed whether such images could still contribute to the dataset. This TINKE moment reflects a gap between well-intentioned participation and scientifically usable data collection.
TINKE 5: Fleming’s parallels
The comparison to Fleming’s discovery was thought-provoking. Many participants likely knew about penicillin, but the deeper TINKE here was the realisation that scientific serendipity is not random luck — it is prepared observation. Fleming noticed the inhibition zone because he was trained to notice it. CUBE is trying to build that same preparation in ordinary citizens.
 Gaps and Misconceptions
Gap 1: Confusing skin mark and nail mark
Several participants may be measuring the distance between the ink on the skin and the current nail base, rather than tracking the movement of the ink mark that is on the nail surface itself. These are different measurements with different biological meanings. This needs to be made explicit in the protocol.
Gap 2: Assuming constant growth rate
The calculation of per-day growth at 0.125 mm/day was derived from a single four-day window. Applying this rate to predict growth at 8 days or 58 hours is mathematically valid only if growth is constant, which biology does not guarantee. Participants need to understand that a rate calculated from early data is a hypothesis, not a confirmed fact.
Gap 3: Sample size and generalisability
The discussion drew from one or two individual cases. A key gap is the implicit assumption that one person’s nail growth rate is representative of others. Age, health, nutritional status, and even the specific finger used all influence growth. Without a large and diverse dataset, no general claims about nail growth rate can be made.
Gap 4: Temporal precision
The observation that “no growth was seen in 34 hours” depended on photographs taken at specific times — but the precision of those timestamps and the consistency of photographic angle and lighting were not fully addressed. Small changes in how the photo is taken can make a 0 mm reading look like 0.2 mm or vice versa.
Gap 5: Misconception — the photo IS the data
Several early participants in the broader CUBE thread treated the photograph as the data itself. The important correction is that the photograph is evidence, and the data is the measurement extracted from it. This distinction matters enormously for how the project is taught and understood.
Gap 6: Engagement vs. rigour trade-off
The project was intentionally designed to be simple enough to attract mass participation. But simplicity can slide into vagueness. The ongoing discussion in the CUBE thread about whether photos need scale references, whether annotations should be added, and how to handle missing data reflects a genuine tension that has not yet been fully resolved.
 Photographs during Chatshaala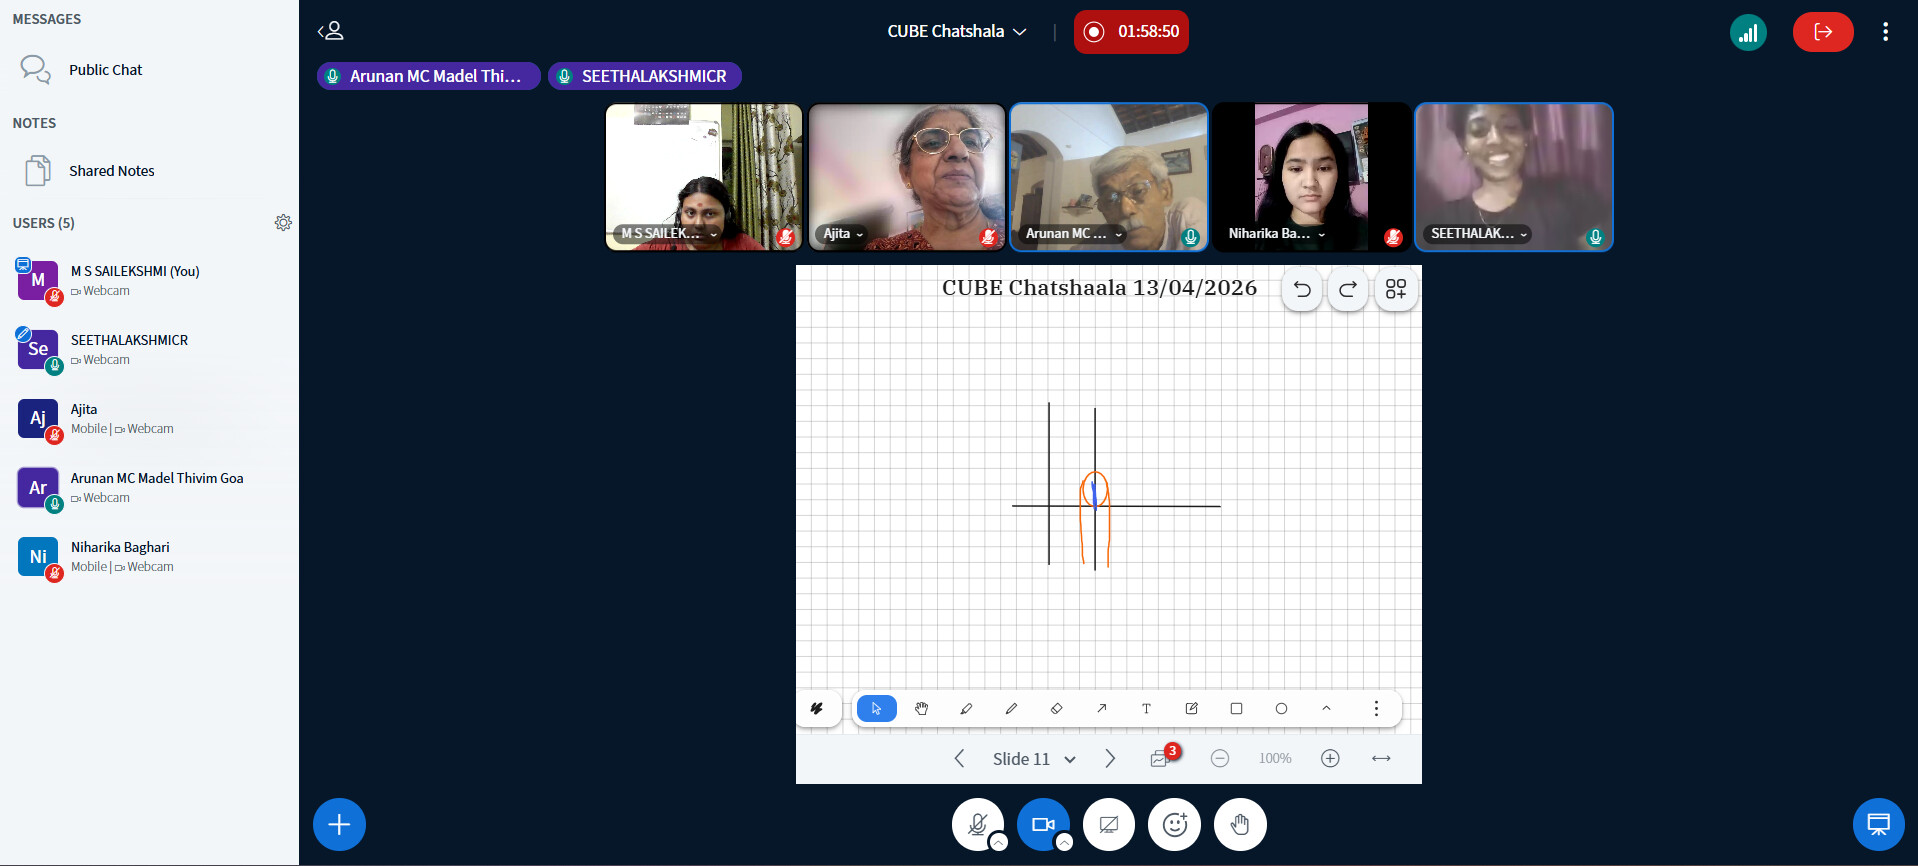
 Referance